
Concept explainers
Videos
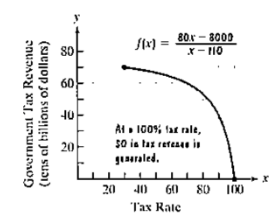
During the 1980s the controversial economist Arthur Laffer promoted the idea that tax increases lead to a reduction in government revenue. Called supply-side economics, the theory uses functions such as
This function models the government tax revenue. f(x), in tens of billions of dollars, in terms of the tax rate, x. the graph of the function is shown, It illustrates tax revenue decreasing quite dramatically as the tax rate increase. At a tax rate of (gasp) 100%. the government takes oil our money and no one has an incentive to work. With no income earned, zero dollars in fox revenue is generated.
Use function f and its graph to solve Exercises 55-56
a. Find and interpret f(30). Identify the solution as a point on the graph. of the function.
b. Rewrite the function by using long division to perform
Then use this new form of the function to find f(30). Do you obtain the same answer as you did in part (a)?
c. is fa polynomial function? Explain your answer.
Want to see the full answer?
Check out a sample textbook solution
Chapter 3 Solutions
COLLEGE ALGEBRA-COMBO ACCESS CARD


- Choose the function to match the graph. -2- 0 -7 -8 -9 --10- |--11- -12- f(x) = log x + 5 f(x) = log x - 5 f(x) = log (x+5) f(x) = log (x-5) 9 10 11 12 13 14arrow_forwardWhich of the following represents the graph of f(x)=3x-2? 7 6 5 4 ++ + + -7-6-5-4-3-2-1 1 2 3 4 5 6 7 -2 3 -5 6 -7 96 7 5 4 O++ -7-6-5-4-3-2-1 -2 -3 -4 -5 -7 765 432 -7-6-5-4-3-2-1 -2 ++ -3 -4 -5 -6 2 3 4 5 6 7 7 6 2 345 67 -7-6-5-4-3-2-1 2 3 4 5 67 4 -5arrow_forward13) Let U = {j, k, l, m, n, o, p} be the universal set. Let V = {m, o,p), W = {l,o, k}, and X = {j,k). List the elements of the following sets and the cardinal number of each set. a) W° and n(W) b) (VUW) and n((V U W)') c) VUWUX and n(V U W UX) d) vnWnX and n(V WnX)arrow_forward
- 9) Use the Venn Diagram given below to determine the number elements in each of the following sets. a) n(A). b) n(A° UBC). U B oh a k gy ท W z r e t ་ Carrow_forward10) Find n(K) given that n(T) = 7,n(KT) = 5,n(KUT) = 13.arrow_forward7) Use the Venn Diagram below to determine the sets A, B, and U. A = B = U = Blue Orange white Yellow Black Pink Purple green Grey brown Uarrow_forward
- 1) Use the roster method to list the elements of the set consisting of: a) All positive multiples of 3 that are less than 20. b) Nothing (An empty set).arrow_forward2) Let M = {all postive integers), N = {0,1,2,3... 100), 0= {100,200,300,400,500). Determine if the following statements are true or false and explain your reasoning. a) NCM b) 0 C M c) O and N have at least one element in common d) O≤ N e) o≤o 1arrow_forward4) Which of the following universal sets has W = {12,79, 44, 18) as a subset? Choose one. a) T = {12,9,76,333, 44, 99, 1000, 2} b) V = {44,76, 12, 99, 18,900,79,2} c) Y = {76,90, 800, 44, 99, 55, 22} d) x = {79,66,71, 4, 18, 22,99,2}arrow_forward
 Holt Mcdougal Larson Pre-algebra: Student Edition...AlgebraISBN:9780547587776Author:HOLT MCDOUGALPublisher:HOLT MCDOUGAL
 College Algebra (MindTap Course List)AlgebraISBN:9781305652231Author:R. David Gustafson, Jeff HughesPublisher:Cengage Learning
 Big Ideas Math A Bridge To Success Algebra 1: Stu...AlgebraISBN:9781680331141Author:HOUGHTON MIFFLIN HARCOURTPublisher:Houghton Mifflin Harcourt
 Glencoe Algebra 1, Student Edition, 9780079039897...AlgebraISBN:9780079039897Author:CarterPublisher:McGraw Hill