
Videos
a)
To find
a)
Answer to Problem 44E
Median = 1.8, First quartile = 1.15, Third quartile =3.1 and IQR = 1.95
Explanation of Solution
Formula:
Median:
First quartile Q1:
Third quartile Q3:
IQR:
Calculation:
Data sorted in ascending order:
| 0.3 | 1.2 | 1.8 | 3.1 |
| 0.5 | 1.2 | 1.8 | 3.1 |
| 0.5 | 1.2 | 1.9 | 3.3 |
| 0.6 | 1.2 | 2.1 | 3.3 |
| 0.6 | 1.3 | 2.1 | 3.4 |
| 0.9 | 1.3 | 2.1 | 3.5 |
| 0.9 | 1.3 | 2.2 | 3.5 |
| 0.9 | 1.3 | 2.4 | 3.5 |
| 0.9 | 1.4 | 2.5 | 3.6 |
| 1 | 1.4 | 2.5 | 3.7 |
| 1.1 | 1.5 | 2.6 | 3.8 |
| 1.1 | 1.5 | 2.7 | 4 |
| 1.1 | 1.5 | 2.7 | 4.2 |
| 1.1 | 1.6 | 2.7 | 4.6 |
| 1.1 | 1.6 | 3 | 5.9 |
| 1.1 | 1.6 | 3.1 | 6.6 |
| 6.6 | |||
Here, n = 65
For finding outlier, first need to find First quartile, Third quartile and IQR.
Median:
First Quartile:
First quartile is 1.15
Third quartile:
Third quartile is 3.1
b)
To find Median, first quartile, third quartile and the IQR for Indians data.
b)
Answer to Problem 44E
Median = 5.6, First quartile = 2.7, Third quartile =6.5 and IQR = 3.8
Explanation of Solution
Formula:
Median:
First quartile Q1:
Third quartile Q3:
IQR:
Calculation:
Data sorted in ascending order:
| 1.1 | 3.8 | 6.3 |
| 1.5 | 3.8 | 6.3 |
| 1.8 | 4.4 | 6.5 |
| 1.9 | 4.4 | 6.5 |
| 2 | 4.7 | 7.3 |
| 2.1 | 5.3 | 7.6 |
| 2.1 | 5.3 | 8.7 |
| 2.4 | 5.6 | 8.9 |
| 2.7 | 5.6 | 9.1 |
| 2.9 | 5.6 | 9.2 |
| 3.3 | 5.8 | 9.5 |
| 3.6 | 5.9 | |
Here, n = 35
For finding outlier, first need to find First quartile, Third quartile and IQR.
First Quartile:
First quartile is 2.7
Third quartile:
Third quartile is 6.5
c)
To find upper and lower outlier limits for sea level
c)
Answer to Problem 44E
Lower outlier limit= -1.775 and upper limit = 6.025
Explanation of Solution
Outliers are those values which are less than Q1-1.5 x IQR and greater than Q3+1.5 x IQR.
Here
Lower outlier boundary is
Upper outlier boundary is
d)
To find upper and lower outlier limits for sea level.
d)
Answer to Problem 44E
Lower outlier limit= -3.38 and upper limit = 12.2
Explanation of Solution
Outliers are those values which are less than Q1-1.5 x IQR and greater than Q3+1.5 x IQR.
Here,
Lower outlier boundary is
Upper outlier boundary is
e)
To construct box plot for both data set.
e)
Explanation of Solution
Box plot for a data set of sea level:
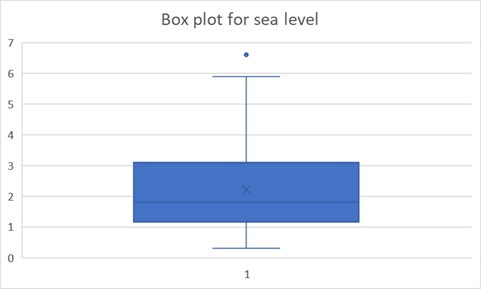
From above Boxplot, it is concluded that 6.6 is the outlier values which is greater than upper outlier limit.
Box plot for a data set High Attitude:
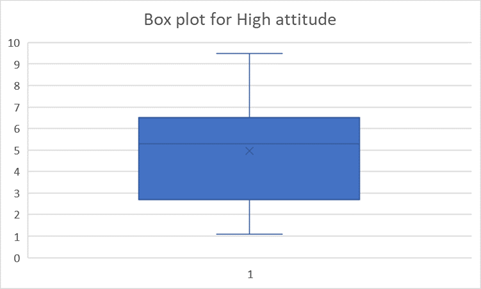
From above Boxplot, it is concluded that, there are no any outlier value in the data set.
Want to see more full solutions like this?
Chapter 3 Solutions
Connect Hosted by ALEKS Access Card or Elementary Statistics


- The following data represent total ventilation measured in liters of air per minute per square meter of body area for two independent (and randomly chosen) samples. Analyze these data using the appropriate non-parametric hypothesis testarrow_forwardeach column represents before & after measurements on the same individual. Analyze with the appropriate non-parametric hypothesis test for a paired design.arrow_forwardShould you be confident in applying your regression equation to estimate the heart rate of a python at 35°C? Why or why not?arrow_forward
- Given your fitted regression line, what would be the residual for snake #5 (10 C)?arrow_forwardCalculate the 95% confidence interval around your estimate of r using Fisher’s z-transformation. In your final answer, make sure to back-transform to the original units.arrow_forwardCalculate Pearson’s correlation coefficient (r) between temperature and heart rate.arrow_forward
 Big Ideas Math A Bridge To Success Algebra 1: Stu...AlgebraISBN:9781680331141Author:HOUGHTON MIFFLIN HARCOURTPublisher:Houghton Mifflin Harcourt
 Glencoe Algebra 1, Student Edition, 9780079039897...AlgebraISBN:9780079039897Author:CarterPublisher:McGraw Hill
 Holt Mcdougal Larson Pre-algebra: Student Edition...AlgebraISBN:9780547587776Author:HOLT MCDOUGALPublisher:HOLT MCDOUGAL
 Functions and Change: A Modeling Approach to Coll...AlgebraISBN:9781337111348Author:Bruce Crauder, Benny Evans, Alan NoellPublisher:Cengage Learning
 Algebra: Structure And Method, Book 1AlgebraISBN:9780395977224Author:Richard G. Brown, Mary P. Dolciani, Robert H. Sorgenfrey, William L. ColePublisher:McDougal Littell
 College Algebra (MindTap Course List)AlgebraISBN:9781305652231Author:R. David Gustafson, Jeff HughesPublisher:Cengage Learning