The changes in
Explanation of Solution
The figure 1 shows the changes in oil price before and during the time of recession.
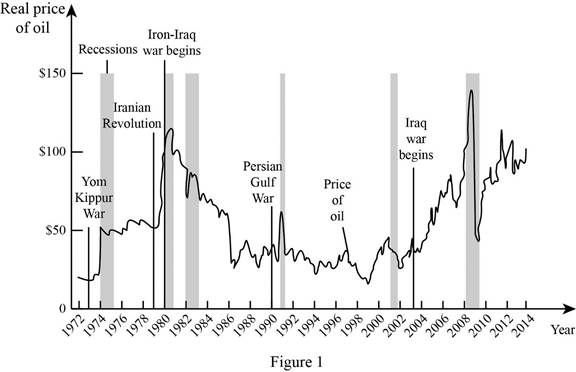
In figure 1, the vertical axis measure the real price of oil and horizontal axis measures the year. The shaded vertical line shows the recession happed in the different years. By comparing the price level in before and during the time of recession, the oil price is raised.
Concept introduction:
Recession: Recession refers to the situation of lower economic activity. During recession times, the economic activities get contrasted and cause lower employment opportunities; as a result, the income of the people will reduce, thereby reducing the
Want to see more full solutions like this?
Chapter 33 Solutions
Modern Principles of Economics

- 1. The current price for a barrel of oil is $28. Assume the marginal extraction cost per barrel is $8 and the interest rate is 4 percent per year. a. According to the standard Hotelling model for a nonrenewable resource, what is the forecasted price for next year? b. How would your forecast change (qualitatively) if the demand for oil increased before next year?arrow_forward• What are the 5 positive and 5 negative attitudes a salesperson has? What are the best way to improve those negative attitudes? • What is the another concise definition of Salesmanship? • As a Watson's salesperson in the Philippines what are they're: - earning opportunities? - chances of promotion and career growth? - rewards and awards? - incentives and fringe benefits? - employment requirements?arrow_forwardWhere in the Victoria, BC is the most logging occurring? Include relative and absolute locationsarrow_forward
- In Foresty , What do most clear cut locations have in common with each other? Do they occur along the shorelines of lakes and rivers? Near major highways? Are they near cities or far from people?arrow_forwardHow sustainable is the forestry industry in BC in your opinion? Not at all, somewhat, very and explain your reasoning.arrow_forwardIn a paragraph, no bullet, points please answer the question and follow the instructions. Give only the solution: Use the Feynman technique throughout. Assume that you’re explaining the answer to someone who doesn’t know the topic at all. 6.Draw a standard Commercial Bank Balance Sheet and briefly explain each of the main components.arrow_forward
- C1 The following model can be used to study whether campaign expenditures affect election outcomes: voteA = 0 + B₁ log(expendA) + ẞ₂ log(expendB) + ẞ3 prtystrA + u, where voteA is the percentage of the vote received by Candidate A, expendA and expend are campaign expenditures by Candidates A and B, and prtystrA is a measure of party strength for Candidate A (the percentage of the most recent presidential vote that went to A's party). == (i) (ii) (iii) (iv) What is the interpretation of B₁? In terms of the parameters, state the null hypothesis that a 1% increase in A's expenditures is offset by a 1% increase in B's expenditures. Estimate the given model using the data in VOTE1.DTA and report the results in usual form. Do A's expenditures affect the outcome? What about B's expenditures? Can you use these results to test the hypothesis in part (ii)? Estimate a model that directly gives the t statistic for testing the hypothesis in part (ii). What do you conclude? (Use a two-sided…arrow_forwardIn a paragraph, no bullet, points please answer the question and follow the instructions. Give only the solution: Use the Feynman technique throughout. Assume that you’re explaining the answer to someone who doesn’t know the topic at all. 10. What is Tinbergen’s constraint? Explain its importance in regard to US monetary policy.arrow_forwardIn a paragraph, no bullet, points please answer the question and follow the instructions. Give only the solution: Use the Feynman technique throughout. Assume that you’re explaining the answer to someone who doesn’t know the topic at all. 8. How does monetary policy supposedly translate into changes in AD?arrow_forward
- In a paragraph, no bullet, points please answer the question and follow the instructions. Give only the solution: Use the Feynman technique throughout. Assume that you’re explaining the answer to someone who doesn’t know the topic at all. 2. Carefully explain either Keynes’ “cookie jar” motive for holding money or the “saw-toothed model’s” motive for holding a safety stock.arrow_forwardIn a paragraph, no bullet, points please answer the question and follow the instructions. Give only the solution: Use the Feynman technique throughout. Assume that you’re explaining the answer to someone who doesn’t know the topic at all. 7.Carefully explain the Fisher equation for interest rates. What insight does it provide?arrow_forwardIn a paragraph, no bullet, points please answer the question and follow the instructions. Give only the solution: Use the Feynman technique throughout. Assume that you’re explaining the answer to someone who doesn’t know the topic at all. 3. Describe the general architecture of the Federal Reserve System.arrow_forward

 Principles of Economics (12th Edition)EconomicsISBN:9780134078779Author:Karl E. Case, Ray C. Fair, Sharon E. OsterPublisher:PEARSON
 Engineering Economy (17th Edition)EconomicsISBN:9780134870069Author:William G. Sullivan, Elin M. Wicks, C. Patrick KoellingPublisher:PEARSON
 Principles of Economics (MindTap Course List)EconomicsISBN:9781305585126Author:N. Gregory MankiwPublisher:Cengage Learning
 Managerial Economics: A Problem Solving ApproachEconomicsISBN:9781337106665Author:Luke M. Froeb, Brian T. McCann, Michael R. Ward, Mike ShorPublisher:Cengage Learning
 Managerial Economics & Business Strategy (Mcgraw-...EconomicsISBN:9781259290619Author:Michael Baye, Jeff PrincePublisher:McGraw-Hill Education