
Concept explainers
Videos
Who is the king of late night TV? An Internet survey estimates that, when given a choice between David Letterman and Jay Leno, 52% of the population prefers to watch Jay Leno. Three late night TV watchers are randomly selected and asked which of the two talk show hosts they prefer.
- a. Find the
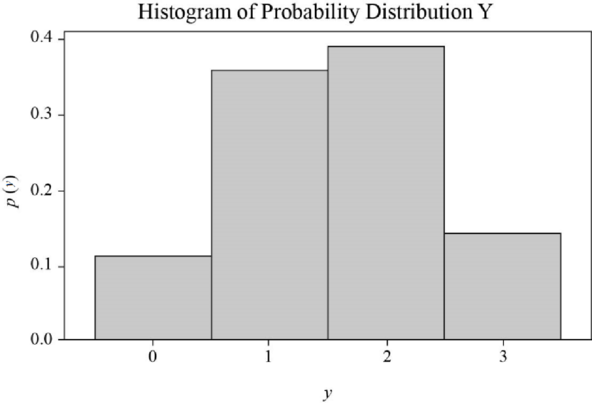
probability distribution for Y, the number of viewers in the sample who prefer Leno. - b. Construct a probability histogram for p(y).
- c. What is the probability that exactly one of the three viewers prefers Leno?
- d. What are the mean and standard deviation for Y?
- e. What is the probability that the number of viewers favoring Leno falls within 2 standard deviations of the mean?
a
Find the probability distribution for Y, the number of viewers in the sample who prefer Leno.
Answer to Problem 15E
The probability distribution for Y, the number of viewers in the sample who prefer Leno is,
| y | 0 | 1 | 2 | 3 |
| 0.1106 | 0.3594 | 0.3894 | 0.1406 |
Explanation of Solution
Calculation:
Define the random variable Y as number of viewers in the sample who prefer Leno is,
. The random variable Y takes values 0, 1, 2 and 3 because three late night TV watchers are selected randomly.
The probability that the population prefers to watch Jay Leno is 0.52, then the probability that the population does not prefers to watch Jay Leno is
The probability for
The probability for
The probability for
The probability for
Hence, the probability distribution for Y, the number of viewers in the sample who prefer Leno is,
| y | 0 | 1 | 2 | 3 |
| 0.1106 | 0.3594 | 0.3894 | 0.1406 |
b
Construct a probability histogram for
Answer to Problem 15E
The probability histogram is,
Explanation of Solution
Calculation:
Step by step procedure to construct histogram:
- In histogram, take the values of random variable Y on x-axis.
- Take the values of probability for random variable Y on y-axis.
- Draw a vertical bar corresponding to value 0 in x-axis with the probability value 0.1106.
- Similarly draw vertical bars for all the probability values by taking the bars side-by-side.
c
Find the probability that exactly one of the three viewers prefers Leno.
Answer to Problem 15E
The probability that exactly one of the three viewers prefers Leno is 0.3594.
Explanation of Solution
Calculation:
The probability that exactly one of the three viewers prefers Leno is,
Hence, the probability that exactly one of the three viewers prefers Leno is 0.3594.
d
Find the mean for Y.
Find the standard deviation for Y.
Answer to Problem 15E
The mean for Y is 1.57.
The standard deviation for Y is 0.8471.
Explanation of Solution
Calculation:
Mean:
For a discrete random variable Y and probability function
The mean of random variable Y is,
Hence, the mean for Y is 1.57.
Standard deviation:
For a discrete random variable Y with mean
The standard deviation of random variable Y is,
Hence, the standard deviation for Y is 0.8471.
e
Find the probability that the number of viewers favoring Leno falls within 2 standard deviations of the mean.
Answer to Problem 15E
The probability that the number of viewers favoring Leno falls within 2 standard deviations of the mean is 1.
Explanation of Solution
Calculation:
Substitute 1.57 for
The limits are
Hence, the probability that the number of viewers favoring Leno falls within 2 standard deviations of the mean is 1.
Want to see more full solutions like this?
Chapter 3 Solutions
Mathematical Statistics with Applications


- To: [Boss's Name] From: Nathaniel D Sain Date: 4/5/2025 Subject: Decision Analysis for Business Scenario Introduction to the Business Scenario Our delivery services business has been experiencing steady growth, leading to an increased demand for faster and more efficient deliveries. To meet this demand, we must decide on the best strategy to expand our fleet. The three possible alternatives under consideration are purchasing new delivery vehicles, leasing vehicles, or partnering with third-party drivers. The decision must account for various external factors, including fuel price fluctuations, demand stability, and competition growth, which we categorize as the states of nature. Each alternative presents unique advantages and challenges, and our goal is to select the most viable option using a structured decision-making approach. Alternatives and States of Nature The three alternatives for fleet expansion were chosen based on their cost implications, operational efficiency, and…arrow_forwardBusinessarrow_forwardWhy researchers are interested in describing measures of the center and measures of variation of a data set?arrow_forward
- WHAT IS THE SOLUTION?arrow_forwardThe following ordered data list shows the data speeds for cell phones used by a telephone company at an airport: A. Calculate the Measures of Central Tendency from the ungrouped data list. B. Group the data in an appropriate frequency table. C. Calculate the Measures of Central Tendency using the table in point B. 0.8 1.4 1.8 1.9 3.2 3.6 4.5 4.5 4.6 6.2 6.5 7.7 7.9 9.9 10.2 10.3 10.9 11.1 11.1 11.6 11.8 12.0 13.1 13.5 13.7 14.1 14.2 14.7 15.0 15.1 15.5 15.8 16.0 17.5 18.2 20.2 21.1 21.5 22.2 22.4 23.1 24.5 25.7 28.5 34.6 38.5 43.0 55.6 71.3 77.8arrow_forwardII Consider the following data matrix X: X1 X2 0.5 0.4 0.2 0.5 0.5 0.5 10.3 10 10.1 10.4 10.1 10.5 What will the resulting clusters be when using the k-Means method with k = 2. In your own words, explain why this result is indeed expected, i.e. why this clustering minimises the ESS map.arrow_forward
- why the answer is 3 and 10?arrow_forwardPS 9 Two films are shown on screen A and screen B at a cinema each evening. The numbers of people viewing the films on 12 consecutive evenings are shown in the back-to-back stem-and-leaf diagram. Screen A (12) Screen B (12) 8 037 34 7 6 4 0 534 74 1645678 92 71689 Key: 116|4 represents 61 viewers for A and 64 viewers for B A second stem-and-leaf diagram (with rows of the same width as the previous diagram) is drawn showing the total number of people viewing films at the cinema on each of these 12 evenings. Find the least and greatest possible number of rows that this second diagram could have. TIP On the evening when 30 people viewed films on screen A, there could have been as few as 37 or as many as 79 people viewing films on screen B.arrow_forwardQ.2.4 There are twelve (12) teams participating in a pub quiz. What is the probability of correctly predicting the top three teams at the end of the competition, in the correct order? Give your final answer as a fraction in its simplest form.arrow_forward
- The table below indicates the number of years of experience of a sample of employees who work on a particular production line and the corresponding number of units of a good that each employee produced last month. Years of Experience (x) Number of Goods (y) 11 63 5 57 1 48 4 54 5 45 3 51 Q.1.1 By completing the table below and then applying the relevant formulae, determine the line of best fit for this bivariate data set. Do NOT change the units for the variables. X y X2 xy Ex= Ey= EX2 EXY= Q.1.2 Estimate the number of units of the good that would have been produced last month by an employee with 8 years of experience. Q.1.3 Using your calculator, determine the coefficient of correlation for the data set. Interpret your answer. Q.1.4 Compute the coefficient of determination for the data set. Interpret your answer.arrow_forwardCan you answer this question for mearrow_forwardTechniques QUAT6221 2025 PT B... TM Tabudi Maphoru Activities Assessments Class Progress lIE Library • Help v The table below shows the prices (R) and quantities (kg) of rice, meat and potatoes items bought during 2013 and 2014: 2013 2014 P1Qo PoQo Q1Po P1Q1 Price Ро Quantity Qo Price P1 Quantity Q1 Rice 7 80 6 70 480 560 490 420 Meat 30 50 35 60 1 750 1 500 1 800 2 100 Potatoes 3 100 3 100 300 300 300 300 TOTAL 40 230 44 230 2 530 2 360 2 590 2 820 Instructions: 1 Corall dawn to tha bottom of thir ceraan urina se se tha haca nariad in archerca antarand cubmit Q Search ENG US 口X 2025/05arrow_forward
 Holt Mcdougal Larson Pre-algebra: Student Edition...AlgebraISBN:9780547587776Author:HOLT MCDOUGALPublisher:HOLT MCDOUGAL
 Algebra and Trigonometry (MindTap Course List)AlgebraISBN:9781305071742Author:James Stewart, Lothar Redlin, Saleem WatsonPublisher:Cengage Learning