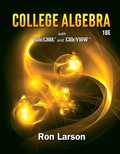
Maximum Volume You construct an open box from a square piece of material, 36 inches on a side, by cutting equal squares with sides of length x from the corners and turning up the sides (see figure). (a) Write a function V that represents the volume of the box. (b) Determine the domain of the function V . (c) Use a graphing utility to construct a table that shows the box heights x and the corresponding volumes V ( x ) . Use the table to estimate the dimensions that produce a maximum volume. (d) Use the graphing utility to graph V and use the graph to estimate the value of x for which V ( x ) is a maximum. Compare your result with that of part (c).
Maximum Volume You construct an open box from a square piece of material, 36 inches on a side, by cutting equal squares with sides of length x from the corners and turning up the sides (see figure). (a) Write a function V that represents the volume of the box. (b) Determine the domain of the function V . (c) Use a graphing utility to construct a table that shows the box heights x and the corresponding volumes V ( x ) . Use the table to estimate the dimensions that produce a maximum volume. (d) Use the graphing utility to graph V and use the graph to estimate the value of x for which V ( x ) is a maximum. Compare your result with that of part (c).
Solution Summary: The author explains the function V that represents the volume of the box, made from a square piece of material, 36 inches, by cutting equal squares with sides of length x from the corners.
Maximum Volume You construct an open box from a square piece of material,
36
inches on a side, by cutting equal squares with sides of length
x
from the corners and turning up the sides (see figure).
(a) Write a function
V
that represents the volume of the box.
(b) Determine the domain of the function
V
.
(c) Use a graphing utility to construct a table that shows the box heights
x
and the corresponding volumes
V
(
x
)
. Use the table to estimate the dimensions that produce a maximum volume.
(d) Use the graphing utility to graph
V
and use the graph to estimate the value of
x
for which
V
(
x
)
is a maximum. Compare your result with that of part (c).
Find the Laplace Transform of the function to express it in frequency domain form.
Please draw a graph that represents the system of equations f(x) = x2 + 2x + 2 and g(x) = –x2 + 2x + 4?
Given the following system of equations and its graph below, what can be determined about the slopes and y-intercepts of the system of equations?
7
y
6
5
4
3
2
-6-5-4-3-2-1
1+
-2
1 2 3 4 5 6
x + 2y = 8
2x + 4y = 12
The slopes are different, and the y-intercepts are different.
The slopes are different, and the y-intercepts are the same.
The slopes are the same, and the y-intercepts are different.
O The slopes are the same, and the y-intercepts are the same.
Need a deep-dive on the concept behind this application? Look no further. Learn more about this topic, algebra and related others by exploring similar questions and additional content below.


 Algebra & Trigonometry with Analytic GeometryAlgebraISBN:9781133382119Author:SwokowskiPublisher:Cengage
 Intermediate AlgebraAlgebraISBN:9781285195728Author:Jerome E. Kaufmann, Karen L. SchwittersPublisher:Cengage Learning
 Trigonometry (MindTap Course List)TrigonometryISBN:9781337278461Author:Ron LarsonPublisher:Cengage Learning
 Glencoe Algebra 1, Student Edition, 9780079039897...AlgebraISBN:9780079039897Author:CarterPublisher:McGraw Hill
 College Algebra (MindTap Course List)AlgebraISBN:9781305652231Author:R. David Gustafson, Jeff HughesPublisher:Cengage Learning