
Concept explainers
Videos
Experts fear that without conservation efforts. tiger could disappear from the wild by 2022. Just out hundred years ago there were at least 100,000 wild tigers, By 2010, the estimated world tiger population was 3200. The bar graph shows the estimated world tiger population for selected years from 1970 through 2010. Also shown is a polynomial function, with its graph, that models the data. Use this information to solve Exercises 73-
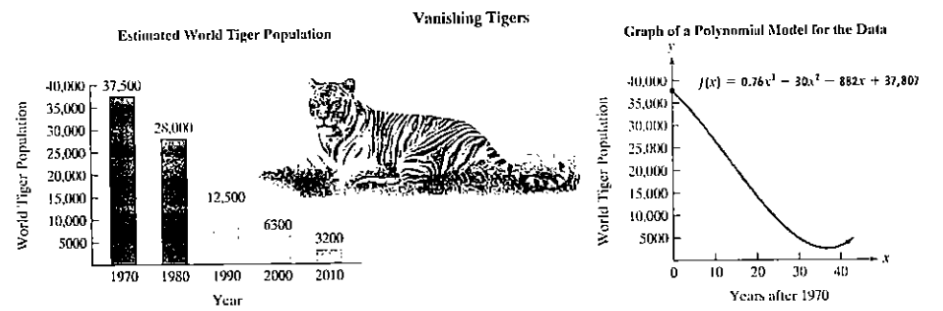
Source: World Wildlife Fund
a. Find and interpret f(10). Identify this information as a point on the graph of f.
b. Does f(10) overestimate or underestimate the actual data shown by the bar graph? By how much?
c. Use the Leading Coefficient Test to determine the end behavior to the right for the graph of f, Might this function be useful in modeling the world tiger population if conservation efforts to save wild tigers are successful? Explain your answer.
Want to see the full answer?
Check out a sample textbook solution
Chapter 3 Solutions
COLLEGE ALGEBRA-MYMATHLAB 18 WEEK >I<


- InThe Northern Lights are bright flashes of colored light between 50 and 200 miles above Earth. Suppose a flash occurs 150 miles above Earth. What is the measure of arc BD, the portion of Earth from which the flash is visible? (Earth’s radius is approximately 4000 miles.)arrow_forwarde). n! (n - 1)!arrow_forwardSuppose you flip a fair two-sided coin four times and record the result. a). List the sample space of this experiment. That is, list all possible outcomes that could occur when flipping a fair two-sided coin four total times. Assume the two sides of the coin are Heads (H) and Tails (T).arrow_forward
- e). n! (n - 1)!arrow_forwardEvaluate the following expression and show your work to support your calculations. a). 6! b). 4! 3!0! 7! c). 5!2! d). 5!2! e). n! (n - 1)!arrow_forwardAmy and Samiha have a hat that contains two playing cards, one ace and one king. They are playing a game where they randomly pick a card out of the hat four times, with replacement. Amy thinks that the probability of getting exactly two aces in four picks is equal to the probability of not getting exactly two aces in four picks. Samiha disagrees. She thinks that the probability of not getting exactly two aces is greater. The sample space of possible outcomes is listed below. A represents an ace, and K represents a king. Who is correct?arrow_forward
- Consider the exponential function f(x) = 12x. Complete the sentences about the key features of the graph. The domain is all real numbers. The range is y> 0. The equation of the asymptote is y = 0 The y-intercept is 1arrow_forwardThe graph shows Alex's distance from home after biking for x hours. What is the average rate of change from -1 to 1 for the function? 4-2 о A. -2 О B. 2 О C. 1 O D. -1 ty 6 4 2 2 0 X 2 4arrow_forwardWrite 7. √49 using rational exponents. ○ A. 57 47 B. 7 O C. 47 ○ D. 74arrow_forward
 Algebra & Trigonometry with Analytic GeometryAlgebraISBN:9781133382119Author:SwokowskiPublisher:Cengage
 College Algebra (MindTap Course List)AlgebraISBN:9781305652231Author:R. David Gustafson, Jeff HughesPublisher:Cengage Learning
 Glencoe Algebra 1, Student Edition, 9780079039897...AlgebraISBN:9780079039897Author:CarterPublisher:McGraw Hill
 College AlgebraAlgebraISBN:9781305115545Author:James Stewart, Lothar Redlin, Saleem WatsonPublisher:Cengage Learning
 Trigonometry (MindTap Course List)TrigonometryISBN:9781337278461Author:Ron LarsonPublisher:Cengage Learning