
Concept explainers
Videos
a.
The number of tumor cells present at diagnosis.
b.
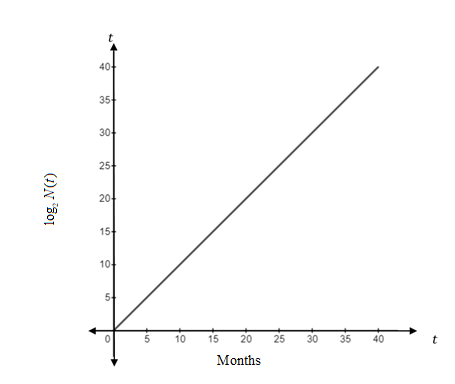
To graph:
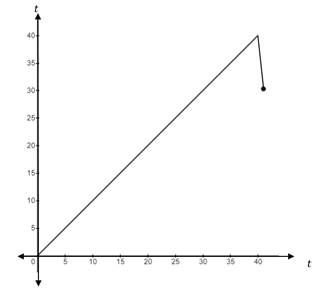
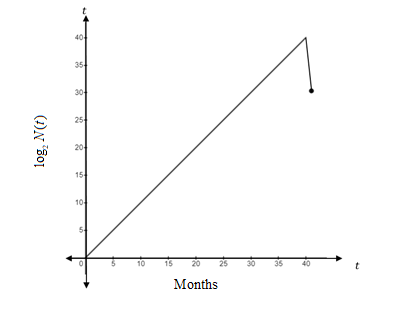
The graph of the function both before and after chemotherapy if patients receives the chemotherapy after the tumor has grown for
Solution:
The graph of the function both and before chemotherapy is:
Explanation:
Given information:
A very aggressive tumor is growing according to the function
Calculation:
The number of tumor cells at
After chemotherapy
So the
Hence the remaining tumor cells are
Here use
So take time
The tumor is continues grow for first
After chemotherapy, the cells are
Thus,
Hence after chemotherapy the graph look like as below:
c.
The discontinuous point in graph of part (b).
Want to see the full answer?
Check out a sample textbook solution
Chapter 3 Solutions
EBK CALCULUS FOR THE LIFE SCIENCES


- Pls help ASAParrow_forward3. True False. If false create functions that prove it is false. Note: f(x) = g(x). a) If_lim ƒ(x) = ∞ and_lim g(x) = ∞,then_lim [ƒ(x) − g(x)] = 0 x→ 0+ x→0+ x→0+ b) If h(x) and g(x) are continuous at x = c, and if h(c) > 0 and g(c) = 0, then h(x) lim. will = x→c g(x) c) If lim f(x) = 0 and lim g(x) = 0 then lim f(x) does not exist. x-a x-a x→a g(x)arrow_forwardPls help ASAParrow_forward
- 15. a) Consider f(x) = x-1 3x+2 and use the difference quotient to determine the simplified expression in terms of x, for the slope of any tangent to y = f(x). Also, determine the slope at x = 2. 15 b) Determine the equation of the tangent to f(x) at x = 2. Final answer in Standard Form Ax + By + C = 0, A ≥ 0, with no fractions or decimals.arrow_forwardPls help ASAParrow_forwardPls help ASAParrow_forward
- Determine whether the series is convergent or divergent. Justify your answer. If the series is convergent, you do not have to find its sum. n=0 (-1) 72n+1 (2n)!arrow_forward+ Find the first five non-zero terms of the Taylor series for f(x) = sin(2x) centered at 4π. + + + ...arrow_forward+ + ... Find the first five non-zero terms of the Taylor series for f(x) centered at x = 4. = 1 x + + +arrow_forward
 Algebra & Trigonometry with Analytic GeometryAlgebraISBN:9781133382119Author:SwokowskiPublisher:Cengage
 Glencoe Algebra 1, Student Edition, 9780079039897...AlgebraISBN:9780079039897Author:CarterPublisher:McGraw Hill
