Finite Mathematics, Books a la Carte Plus MyLab Math Access Card Package (11th Edition)
11th Edition
ISBN: 9780133886818
Author: Margaret L. Lial, Raymond N. Greenwell, Nathan P. Ritchey
Publisher: PEARSON
expand_more
expand_more
format_list_bulleted
Videos
Textbook Question
Chapter 3.2, Problem 1E
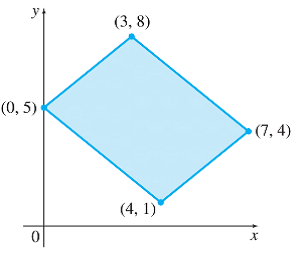
The following graphs show regions of feasible solutions. Use these regions to find maximum and minimum values of the given objective functions.
(a) z = 3x + 2y
(b) z = x + 4y
Expert Solution & Answer
Want to see the full answer?
Check out a sample textbook solution
Students have asked these similar questions
Answer number one
answer number 4
3. Bayesian Inference – Updating Beliefs
A medical test for a rare disease has the following characteristics:
Sensitivity (true positive rate): 99%
Specificity (true negative rate): 98%
The disease occurs in 0.5% of the population.
A patient receives a positive test result.
Questions:
a) Define the relevant events and use Bayes’ Theorem to compute the probability that the patient actually has the disease.b) Explain why the result might seem counterintuitive, despite the high sensitivity and specificity.c) Discuss how prior probabilities influence posterior beliefs in Bayesian inference.d) Suppose a second, independent test with the same accuracy is conducted and is also positive. Update the probability that the patient has the disease.
Chapter 3 Solutions
Finite Mathematics, Books a la Carte Plus MyLab Math Access Card Package (11th Edition)
Ch. 3.1 - Graph each linear inequality. x + y 2Ch. 3.1 - Graph each linear inequality. y x + 1Ch. 3.1 - Graph each linear inequality. x 2 yCh. 3.1 - Graph each linear inequality. y x 3Ch. 3.1 - Graph each linear inequality. 4x y 6Ch. 3.1 - Graph each linear inequality. 4y + x 6Ch. 3.1 - Graph each linear inequality. 7. 4x + y 8Ch. 3.1 - Graph each linear inequality. 2x y 2Ch. 3.1 - Graph each linear inequality. x + 3y 2Ch. 3.1 - Graph each linear inequality. 2x + 3y 6
Ch. 3.1 - Graph each linear inequality. x 3yCh. 3.1 - Graph each linear inequality. 2x yCh. 3.1 - Graph each linear inequality. x + y 0Ch. 3.1 - Graph each linear inequality. 3x + 2y 0Ch. 3.1 - Graph each linear inequality. y xCh. 3.1 - Graph each linear inequality. y 5xCh. 3.1 - Graph each linear inequality. x 4Ch. 3.1 - Graph each linear inequality. y 5Ch. 3.1 - Graph each linear inequality. y 2Ch. 3.1 - Graph each linear inequality. x 4Ch. 3.1 - Graph the feasible region for each system of...Ch. 3.1 - Graph the feasible region for each system of...Ch. 3.1 - Graph the feasible region for each system of...Ch. 3.1 - Graph the feasible region for each system of...Ch. 3.1 - Graph the feasible region for each system of...Ch. 3.1 - Graph the feasible region for each system of...Ch. 3.1 - Graph the feasible region for each system of...Ch. 3.1 - Graph the feasible region for each system of...Ch. 3.1 - Graph the feasible region for each system of...Ch. 3.1 - Graph the feasible region for each system of...Ch. 3.1 - Graph the feasible region for each system of...Ch. 3.1 - Graph the feasible region for each system of...Ch. 3.1 - Graph the feasible region for each system of...Ch. 3.1 - Graph the feasible region for each system of...Ch. 3.1 - Prob. 35ECh. 3.1 - Prob. 36ECh. 3.1 - Prob. 37ECh. 3.1 - Prob. 38ECh. 3.1 - The regions A through G in the figure can be...Ch. 3.1 - Production Scheduling A small pottery shop makes...Ch. 3.1 - Time Management Carmella and Walt produce handmade...Ch. 3.1 - Prob. 42ECh. 3.1 - Prob. 43ECh. 3.1 - Prob. 44ECh. 3.1 - For Exercises 42-47, perform the following steps....Ch. 3.1 - Prob. 46ECh. 3.1 - Prob. 47ECh. 3.2 - The following graphs show regions of feasible...Ch. 3.2 - The following graphs show regions of feasible...Ch. 3.2 - The following graphs show regions of feasible...Ch. 3.2 - The following graphs show regions of feasible...Ch. 3.2 - The following graphs show regions of feasible...Ch. 3.2 - Prob. 6ECh. 3.2 - Prob. 7ECh. 3.2 - Use graphical methods to solve each linear...Ch. 3.2 - Prob. 9ECh. 3.2 - Use graphical methods to solve each linear...Ch. 3.2 - Prob. 11ECh. 3.2 - Prob. 12ECh. 3.2 - Prob. 13ECh. 3.2 - Prob. 14ECh. 3.2 - Prob. 15ECh. 3.2 - Use graphical methods to solve each linear...Ch. 3.2 - Use graphical methods to solve each linear...Ch. 3.3 - Write Exercises 16 as linear inequalities....Ch. 3.3 - Prob. 2ECh. 3.3 - Prob. 3ECh. 3.3 - Prob. 4ECh. 3.3 - Prob. 5ECh. 3.3 - Prob. 6ECh. 3.3 - Transportation The Miers Company produces small...Ch. 3.3 - Transportation A manufacturer of refrigerators...Ch. 3.3 - Finance A pension fund manager decides to invest a...Ch. 3.3 - Profit A small country can grow only two crops for...Ch. 3.3 - Prob. 11ECh. 3.3 - Revenue A candy company has 150 kg of...Ch. 3.3 - Blending The Mostpure Milk Company gets milk from...Ch. 3.3 - Profit The Muro Manufacturing Company makes two...Ch. 3.3 - Prob. 15ECh. 3.3 - Revenue The manufacturing process requires that...Ch. 3.3 - Prob. 17ECh. 3.3 - Manufacturing (Note: Exercises #x2013;20 are from...Ch. 3.3 - Prob. 19ECh. 3.3 - Prob. 20ECh. 3.3 - Life Sciences Health Care David Willis takes...Ch. 3.3 - Prob. 22ECh. 3.3 - Nutrition A dietician is planning a snack package...Ch. 3.3 - Prob. 24ECh. 3.3 - Anthropology An anthropology article presents a...Ch. 3.3 - Prob. 26ECh. 3.3 - Prob. 27ECh. 3 - Use sensitivity analysis to find the optimal...Ch. 3 - Prob. 2EACh. 3 - Prob. 3EACh. 3 - Prob. 4EACh. 3 - Prob. 5EACh. 3 - Prob. 1RECh. 3 - Prob. 2RECh. 3 - Prob. 3RECh. 3 - Prob. 4RECh. 3 - Prob. 5RECh. 3 - Prob. 6RECh. 3 - Prob. 7RECh. 3 - Prob. 8RECh. 3 - Prob. 9RECh. 3 - Prob. 10RECh. 3 - Prob. 11RECh. 3 - Prob. 12RECh. 3 - Prob. 13RECh. 3 - How many constraints are we limited to in the...Ch. 3 - Prob. 15RECh. 3 - Prob. 16RECh. 3 - Prob. 17RECh. 3 - Prob. 18RECh. 3 - Prob. 19RECh. 3 - Prob. 20RECh. 3 - Prob. 21RECh. 3 - Prob. 22RECh. 3 - Prob. 23RECh. 3 - Prob. 24RECh. 3 - Prob. 25RECh. 3 - Prob. 26RECh. 3 - Prob. 27RECh. 3 - Use the given regions to find the maximum and...Ch. 3 - Prob. 29RECh. 3 - Prob. 30RECh. 3 - Prob. 31RECh. 3 - Prob. 32RECh. 3 - Prob. 33RECh. 3 - Prob. 34RECh. 3 - Prob. 35RECh. 3 - Prob. 36RECh. 3 - Prob. 37RECh. 3 - Cost Analysis DeMarco's pizza shop makes two...Ch. 3 - Prob. 39RECh. 3 - Revenue How many pizzas of each kind should the...Ch. 3 - Prob. 41RECh. 3 - Prob. 42RECh. 3 - Steel A steel company produces two types of...Ch. 3 - Prob. 44RECh. 3 - Prob. 45RECh. 3 - Prob. 46RE
Additional Math Textbook Solutions
Find more solutions based on key concepts
In Exercises 9-20, use the data in the following table, which lists drive-thru order accuracy at popular fast f...
Elementary Statistics (13th Edition)
1. How much money is Joe earning when he’s 30?
Pathways To Math Literacy (looseleaf)
True or False The quotient of two polynomial expressions is a rational expression, (p. A35)
Precalculus
First Derivative Test a. Locale the critical points of f. b. Use the First Derivative Test to locale the local ...
Calculus: Early Transcendentals (2nd Edition)
For Problems 23-28, write in simpler form, as in Example 4. logbFG
Finite Mathematics for Business, Economics, Life Sciences and Social Sciences
1. How is a sample related to a population?
Elementary Statistics: Picturing the World (7th Edition)
Knowledge Booster


Learn more about
Need a deep-dive on the concept behind this application? Look no further. Learn more about this topic, subject and related others by exploring similar questions and additional content below.Similar questions
- answer number 6arrow_forwardanswer number 2arrow_forward4. Linear Regression - Model Assumptions and Interpretation A real estate analyst is studying how house prices (Y) are related to house size in square feet (X). A simple linear regression model is proposed: The analyst fits the model and obtains: • Ŷ50,000+150X YBoB₁X + € • R² = 0.76 • Residuals show a fan-shaped pattern when plotted against fitted values. Questions: a) Interpret the slope coefficient in context. b) Explain what the R² value tells us about the model's performance. c) Based on the residual pattern, what regression assumption is likely violated? What might be the consequence? d) Suggest at least two remedies to improve the model, based on the residual analysis.arrow_forward
- 5. Probability Distributions – Continuous Random Variables A factory machine produces metal rods whose lengths (in cm) follow a continuous uniform distribution on the interval [98, 102]. Questions: a) Define the probability density function (PDF) of the rod length.b) Calculate the probability that a randomly selected rod is shorter than 99 cm.c) Determine the expected value and variance of rod lengths.d) If a sample of 25 rods is selected, what is the probability that their average length is between 99.5 cm and 100.5 cm? Justify your answer using the appropriate distribution.arrow_forward2. Hypothesis Testing - Two Sample Means A nutritionist is investigating the effect of two different diet programs, A and B, on weight loss. Two independent samples of adults were randomly assigned to each diet for 12 weeks. The weight losses (in kg) are normally distributed. Sample A: n = 35, 4.8, s = 1.2 Sample B: n=40, 4.3, 8 = 1.0 Questions: a) State the null and alternative hypotheses to test whether there is a significant difference in mean weight loss between the two diet programs. b) Perform a hypothesis test at the 5% significance level and interpret the result. c) Compute a 95% confidence interval for the difference in means and interpret it. d) Discuss assumptions of this test and explain how violations of these assumptions could impact the results.arrow_forward1. Sampling Distribution and the Central Limit Theorem A company produces batteries with a mean lifetime of 300 hours and a standard deviation of 50 hours. The lifetimes are not normally distributed—they are right-skewed due to some batteries lasting unusually long. Suppose a quality control analyst selects a random sample of 64 batteries from a large production batch. Questions: a) Explain whether the distribution of sample means will be approximately normal. Justify your answer using the Central Limit Theorem. b) Compute the mean and standard deviation of the sampling distribution of the sample mean. c) What is the probability that the sample mean lifetime of the 64 batteries exceeds 310 hours? d) Discuss how the sample size affects the shape and variability of the sampling distribution.arrow_forward
- An airplane flies due west at an airspeed of 428 mph. The wind blows in the direction of 41° south of west at 50 mph. What is the ground speed of the airplane? What is the bearing of the airplane? 428 mph 41° 50 mph a. The ground speed of the airplane is b. The bearing of the airplane is mph. south of west.arrow_forwardRylee's car is stuck in the mud. Roman and Shanice come along in a truck to help pull her out. They attach one end of a tow strap to the front of the car and the other end to the truck's trailer hitch, and the truck starts to pull. Meanwhile, Roman and Shanice get behind the car and push. The truck generates a horizontal force of 377 lb on the car. Roman and Shanice are pushing at a slight upward angle and generate a force of 119 lb on the car. These forces can be represented by vectors, as shown in the figure below. The angle between these vectors is 20.2°. Find the resultant force (the vector sum), then give its magnitude and its direction angle from the positive x-axis. 119 lb 20.2° 377 lb a. The resultant force is (Tip: omit degree notations from your answers; e.g. enter cos(45) instead of cos(45°)) b. It's magnitude is lb. c. It's angle from the positive x-axis isarrow_forwardComplete the table below. For solutions, round to the nearest whole number.arrow_forward
- A biologist is investigating the effect of potential plant hormones by treating 20 stem segments. At the end of the observation period he computes the following length averages: Compound X = 1.18 Compound Y = 1.17 Based on these mean values he concludes that there are no treatment differences. 1) Are you satisfied with his conclusion? Why or why not? 2) If he asked you for help in analyzing these data, what statistical method would you suggest that he use to come to a meaningful conclusion about his data and why? 3) Are there any other questions you would ask him regarding his experiment, data collection, and analysis methods?arrow_forwardBusinessarrow_forwardAnswer first questionarrow_forward
arrow_back_ios
SEE MORE QUESTIONS
arrow_forward_ios
Recommended textbooks for you
 Glencoe Algebra 1, Student Edition, 9780079039897...AlgebraISBN:9780079039897Author:CarterPublisher:McGraw Hill
 Algebra for College StudentsAlgebraISBN:9781285195780Author:Jerome E. Kaufmann, Karen L. SchwittersPublisher:Cengage Learning
 Elementary Linear Algebra (MindTap Course List)AlgebraISBN:9781305658004Author:Ron LarsonPublisher:Cengage Learning
 College Algebra (MindTap Course List)AlgebraISBN:9781305652231Author:R. David Gustafson, Jeff HughesPublisher:Cengage Learning
 Algebra: Structure And Method, Book 1AlgebraISBN:9780395977224Author:Richard G. Brown, Mary P. Dolciani, Robert H. Sorgenfrey, William L. ColePublisher:McDougal Littell
 Algebra & Trigonometry with Analytic GeometryAlgebraISBN:9781133382119Author:SwokowskiPublisher:Cengage
Glencoe Algebra 1, Student Edition, 9780079039897...
Algebra
ISBN:9780079039897
Author:Carter
Publisher:McGraw Hill
Algebra for College Students
Algebra
ISBN:9781285195780
Author:Jerome E. Kaufmann, Karen L. Schwitters
Publisher:Cengage Learning
Elementary Linear Algebra (MindTap Course List)
Algebra
ISBN:9781305658004
Author:Ron Larson
Publisher:Cengage Learning
College Algebra (MindTap Course List)
Algebra
ISBN:9781305652231
Author:R. David Gustafson, Jeff Hughes
Publisher:Cengage Learning
Algebra: Structure And Method, Book 1
Algebra
ISBN:9780395977224
Author:Richard G. Brown, Mary P. Dolciani, Robert H. Sorgenfrey, William L. Cole
Publisher:McDougal Littell
Algebra & Trigonometry with Analytic Geometry
Algebra
ISBN:9781133382119
Author:Swokowski
Publisher:Cengage
Solve ANY Optimization Problem in 5 Steps w/ Examples. What are they and How do you solve them?; Author: Ace Tutors;https://www.youtube.com/watch?v=BfOSKc_sncg;License: Standard YouTube License, CC-BY
Types of solution in LPP|Basic|Multiple solution|Unbounded|Infeasible|GTU|Special case of LP problem; Author: Mechanical Engineering Management;https://www.youtube.com/watch?v=F-D2WICq8Sk;License: Standard YouTube License, CC-BY
Optimization Problems in Calculus; Author: Professor Dave Explains;https://www.youtube.com/watch?v=q1U6AmIa_uQ;License: Standard YouTube License, CC-BY
Introduction to Optimization; Author: Math with Dr. Claire;https://www.youtube.com/watch?v=YLzgYm2tN8E;License: Standard YouTube License, CC-BY