Use a calculator with an y x key to solve Exercises 71-76. The bar graph shows the percentage of U.S. high school seniors who applied to more than three colleges for selected years from 1980 through 2013. The data can he modeled by f ( x ) = x + 31 and g ( x ) = 32 ⋅ 7 e 0 ⋅ 0217 x , in which f(x) and g(x) represent the percentage of high school seniors who applied to more than three colleges x years after 1980. Use these functions to solve Exercises 71-72. Where necessary, round answers to the nearest percent. a. According to the linear model, what percentage of high school seniors applied to more than three colleges in 2010? b. According to the exponential model, what percentage of high school seniors applied to more than three colleges in 20107 c. Which function is a belter model for the data shown by the bar graph in 2010?
Use a calculator with an y x key to solve Exercises 71-76. The bar graph shows the percentage of U.S. high school seniors who applied to more than three colleges for selected years from 1980 through 2013. The data can he modeled by f ( x ) = x + 31 and g ( x ) = 32 ⋅ 7 e 0 ⋅ 0217 x , in which f(x) and g(x) represent the percentage of high school seniors who applied to more than three colleges x years after 1980. Use these functions to solve Exercises 71-72. Where necessary, round answers to the nearest percent. a. According to the linear model, what percentage of high school seniors applied to more than three colleges in 2010? b. According to the exponential model, what percentage of high school seniors applied to more than three colleges in 20107 c. Which function is a belter model for the data shown by the bar graph in 2010?
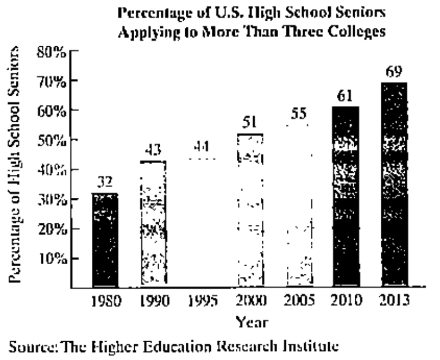
Solution Summary: The author calculates the percentage of high school seniors applying to more than 3 colleges in 2010 based on the linear model f(x)=x+31 where x is the number of years after 1980.
Use a calculator with an
y
x
key to solve Exercises 71-76.
The bar graph shows the percentage of U.S. high school seniors who applied to more than three colleges for selected years from 1980 through 2013.
The data can he modeled by
f
(
x
)
=
x
+
31
and
g
(
x
)
=
32
⋅
7
e
0
⋅
0217
x
,
in which f(x) and g(x) represent the percentage of high school seniors who applied to more than three colleges x years after 1980. Use these functions to solve Exercises 71-72. Where necessary, round answers to the nearest percent.
a. According to the linear model, what percentage of high school seniors applied to more than three colleges in 2010?
b. According to the exponential model, what percentage of high school seniors applied to more than three colleges in 20107
c. Which function is a belter model for the data shown by the bar graph in 2010?
Evaluate the triple integral
3'
23
HIG
2
+3
f(x, y, z)dxdydz where f(x, y, z) = x +
2x-y
ม
u =
v =
and w =
2
2
3
Triple Integral
Region R
-2
x
N
2
y
3
Find the volume of the solid bounded below by the circular cone z = 2.5√√√x² + y² and above by the
sphere x² + y²+z² = 6.5z.
Electric charge is distributed over the triangular region D shown below so that the charge density at (x, y)
is σ(x, y) = 4xy, measured in coulumbs per square meter (C/m²). Find the total charge on D. Round
your answer to four decimal places.
1
U
5
4
3
2
1
1
2
5
7
coulumbs
Chapter 3 Solutions
Precalculus, Books A La Carte Edition Plus MyLab Math with eText -- Access Card Package (6th Edition)
Need a deep-dive on the concept behind this application? Look no further. Learn more about this topic, calculus and related others by exploring similar questions and additional content below.


 Algebra & Trigonometry with Analytic GeometryAlgebraISBN:9781133382119Author:SwokowskiPublisher:Cengage
 Glencoe Algebra 1, Student Edition, 9780079039897...AlgebraISBN:9780079039897Author:CarterPublisher:McGraw Hill
 Algebra: Structure And Method, Book 1AlgebraISBN:9780395977224Author:Richard G. Brown, Mary P. Dolciani, Robert H. Sorgenfrey, William L. ColePublisher:McDougal Littell
 Trigonometry (MindTap Course List)TrigonometryISBN:9781337278461Author:Ron LarsonPublisher:Cengage Learning
 College Algebra (MindTap Course List)AlgebraISBN:9781305652231Author:R. David Gustafson, Jeff HughesPublisher:Cengage Learning
 Holt Mcdougal Larson Pre-algebra: Student Edition...AlgebraISBN:9780547587776Author:HOLT MCDOUGALPublisher:HOLT MCDOUGAL