Use a calculator with an y x key to solve Exercises 71-76. The bar graph shows the percentage of U.S high school seniors who applied to more than three colleges for selected years from 1980 through 2013. The data can he modeled by f ( x ) = x + 31 and g ( x ) = 32 ⋅ 7 e 0 ⋅ 0217 x , in which f(x) and g(x) represent the percentage of high school seniors who applied to more than three colleges x years after 1980. Use these functions to solve Exercises 71-72. Where necessary, round answers to the nearest percent. a. According to the linear model, what percentage of high school seniors applied to more than three colleges in 2013? b. According to the exponential model, what percentage of high school seniors applied to more than three colleges in 2013? c. Which function is a belter model for the data shown by the bar graph in 2013?
Use a calculator with an y x key to solve Exercises 71-76. The bar graph shows the percentage of U.S high school seniors who applied to more than three colleges for selected years from 1980 through 2013. The data can he modeled by f ( x ) = x + 31 and g ( x ) = 32 ⋅ 7 e 0 ⋅ 0217 x , in which f(x) and g(x) represent the percentage of high school seniors who applied to more than three colleges x years after 1980. Use these functions to solve Exercises 71-72. Where necessary, round answers to the nearest percent. a. According to the linear model, what percentage of high school seniors applied to more than three colleges in 2013? b. According to the exponential model, what percentage of high school seniors applied to more than three colleges in 2013? c. Which function is a belter model for the data shown by the bar graph in 2013?
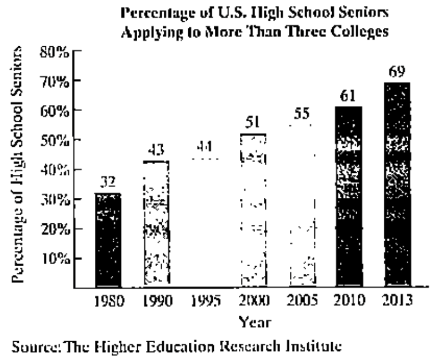
Solution Summary: The author calculates the percentage of high school seniors applying to more than 3 colleges in 2013 based on the linear model f(x)=x+31 where x is the number of years after 1980.
Use a calculator with an
y
x
key to solve Exercises 71-76.
The bar graph shows the percentage of U.S high school seniors who applied to more than three colleges for selected years from 1980 through 2013.
The data can he modeled by
f
(
x
)
=
x
+
31
and
g
(
x
)
=
32
⋅
7
e
0
⋅
0217
x
,
in which f(x) and g(x) represent the percentage of high school seniors who applied to more than three colleges x years after 1980. Use these functions to solve Exercises 71-72. Where necessary, round answers to the nearest percent.
a. According to the linear model, what percentage of high school seniors applied to more than three colleges in 2013?
b. According to the exponential model, what percentage of high school seniors applied to more than three colleges in 2013?
c. Which function is a belter model for the data shown by the bar graph in 2013?
Consider the following system of equations, Ax=b :
x+2y+3z - w = 2
2x4z2w = 3
-x+6y+17z7w = 0
-9x-2y+13z7w = -14
a. Find the solution to the system. Write it as a parametric equation. You can use a
computer to do the row reduction.
b. What is a geometric description of the solution? Explain how you know.
c. Write the solution in vector form?
d. What is the solution to the homogeneous system, Ax=0?
2. Find a matrix A with the following qualities
a. A is 3 x 3.
b. The matrix A is not lower triangular and is not upper triangular.
c. At least one value in each row is not a 1, 2,-1, -2, or 0
d. A is invertible.
Need a deep-dive on the concept behind this application? Look no further. Learn more about this topic, calculus and related others by exploring similar questions and additional content below.


 Algebra & Trigonometry with Analytic GeometryAlgebraISBN:9781133382119Author:SwokowskiPublisher:Cengage
 Algebra: Structure And Method, Book 1AlgebraISBN:9780395977224Author:Richard G. Brown, Mary P. Dolciani, Robert H. Sorgenfrey, William L. ColePublisher:McDougal Littell
 Glencoe Algebra 1, Student Edition, 9780079039897...AlgebraISBN:9780079039897Author:CarterPublisher:McGraw Hill
 Trigonometry (MindTap Course List)TrigonometryISBN:9781337278461Author:Ron LarsonPublisher:Cengage Learning
 College Algebra (MindTap Course List)AlgebraISBN:9781305652231Author:R. David Gustafson, Jeff HughesPublisher:Cengage Learning
 Holt Mcdougal Larson Pre-algebra: Student Edition...AlgebraISBN:9780547587776Author:HOLT MCDOUGALPublisher:HOLT MCDOUGAL