Concept explainers
(a)
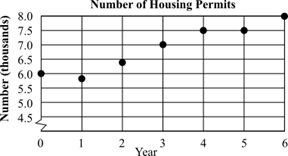
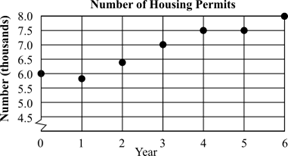
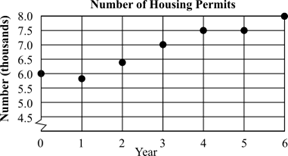
The year for which the number of permits was greatest when the number of housing permits (in thousands) issued by a country in Texas between year

(b)
The number of permits country issued in year

(c)
The years in which number of permits decreased when the number of housing permits (in thousands) issued by a country in Texas between year

(d)
The two years between which number of permits remained the same when the number of housing permits (in thousands) issued by a country in Texas between year

(e)
The year which corresponds to

Want to see the full answer?
Check out a sample textbook solution
Chapter 3 Solutions
BEG+INTERMEDIATE ALG CNCT MATH ALEKS AC
- Draw the image of the following figure after a dilation centered at the origin with a scale factor of 14 退 14 12- 10 5- + Z 6 的 A X 10 12 14 16 18 G min 3 5arrow_forwardkofi makes a candle as a gift for his mom. The candle is a cube with a volume of 8/125 ft cubed. Kofi wants to paint each face of the candle exepct for the bottom. what is the area he will paint?arrow_forward10 6 9. 8 -7- 6. 5. 4- 3. 2 1- -1 0 -1 2 3 4 ·10 5 6 7 00 8 6 10arrow_forward
- Week 3: Mortgages and Amortiza X + rses/167748/assignments/5379530?module_item_id=23896312 11:59pm Points 10 Submitting an external tool Gider the following monthly amortization schedule: Payment # Payment Interest Debt Payment Balance 1 1,167.34 540.54 626.80 259,873.20 2 1,167.34 539.24 628.10 259,245.10 3 1,167.34 With the exception of column one, all amounts are in dollars. Calculate the annual interest rate on this loa Round your answer to the nearest hundredth of a percent. Do NOT round until you calculate the final answer. * Previous a Earrow_forwardCafé Michigan's manager, Gary Stark, suspects that demand for mocha latte coffees depends on the price being charged. Based on historical observations, Gary has gathered the following data, which show the numbers of these coffees sold over six different price values: Price Number Sold $2.70 765 $3.50 515 $2.00 990 $4.30 240 $3.10 325 $4.00 475 Using simple linear regression and given that the price per cup is $1.85, the forecasted demand for mocha latte coffees will be cups (enter your response rounded to one decimal place).arrow_forwardGiven the correlation coefficient (r-value), determine the strength of the relationship. Defend your answersarrow_forward
- ??!!arrow_forwardrections: For problem rough 3, read each question carefully and be sure to show all work. 1. Determine if 9(4a²-4ab+b²) = (6a-3b)² is a polynomial identity. 2. Is (2x-y) (8x3+ y³) equivalent to 16x4-y4? 3. Find an expression that is equivalent to (a - b)³. Directions: For problems 4 and 5, algebraically prove that the following equations are polynomial identities. Show all of your work and explain each step. 4. (2x+5)² = 4x(x+5)+25 5. (4x+6y)(x-2y)=2(2x²-xy-6y²)arrow_forwardName: Mussels & bem A section of a river currently has a population of 20 zebra mussels. The population of zebra mussels increases 60 % each month. What will be the population of zebra mussels after 2 years? 9 10 # of months # of mussels 1 2 3 4 5 6 7 8 o Graph your data. Remember to title your graph. What scale should be used on the y-axis? What scale should be used on the x-axis? Exponential Growth Equation y = a(1+r)*arrow_forward
- In a national park, the current population of an endangered species of bear is 80. Each year, the population decreases by 10%. How can you model the population of bears in the park? # of years # of bears 9 10 2 3 4 5 6 7 8 ° 1 Graph your data. Remember to title your graph. What scale should be used on the y-axis? What scale should be used on the x-axis? SMOKY 19 OUNTAINS NATIONAL Exponential Decay Equation y = a(1-r)* PARKarrow_forwardOn Feb. 8, this year, at 6am in the morning all UiB meteorology professors met to discuss a highly unfortunate and top-urgent crisis: Their most precious instrument, responsible for measuring the air temperature hour-by- hour, had failed - what if the Bergen public would find out? How would they plan their weekend without up-to-date air temperature readings? Silent devastation - and maybe a hint of panic, also - hung in the room. Apprentice Taylor, who - as always - was late to the meeting, sensed that this was his chance to shine! Could they fake the data? At least for some hours (until the measurements would work again)? He used to spend a lot of time online and thus knew the value of fake data, especially when it spread fast! He reminded the crying professors of a prehistoric project with the title "Love your derivatives as you love yourself!" - back then, they had installed top-modern technology that not only measured the air temperature itself, but also its 1st, 2nd, 3rd, 4th, and…arrow_forwardConsider a forest where the population of a particular plant species grows exponentially. In a real-world scenario, we often deal with systems where the analytical function describing the phenomenon is not available. In such cases, numerical methods come in handy. For the sake of this task, however, you are provided with an analytical function so that you can compare the results of the numerical methods to some ground truth. The population P(t) of the plants at time t (in years) is given by the equation: P(t) = 200 0.03 t You are tasked with estimating the rate of change of the plant population at t = 5 years using numerical differentiation methods. First, compute the value of P'(t) at t = 5 analytically. Then, estimate P'(t) at t = 5 years using the following numerical differentiation methods: ⚫ forward difference method (2nd-order accurate) 3 ⚫ backward difference method (2nd-order accurate) ⚫ central difference method (2nd-order accurate) Use h = 0.5 as the step size and round all…arrow_forward
 Holt Mcdougal Larson Pre-algebra: Student Edition...AlgebraISBN:9780547587776Author:HOLT MCDOUGALPublisher:HOLT MCDOUGAL
 Big Ideas Math A Bridge To Success Algebra 1: Stu...AlgebraISBN:9781680331141Author:HOUGHTON MIFFLIN HARCOURTPublisher:Houghton Mifflin Harcourt

