Elementary Statistics, Books A La Carte Edition (13th Edition)
13th Edition
ISBN: 9780134463063
Author: Mario F. Triola
Publisher: PEARSON
expand_more
expand_more
format_list_bulleted
Concept explainers
Videos
Textbook Question
Chapter 3.1, Problem 23BSC
In Exercises 21-24, find the
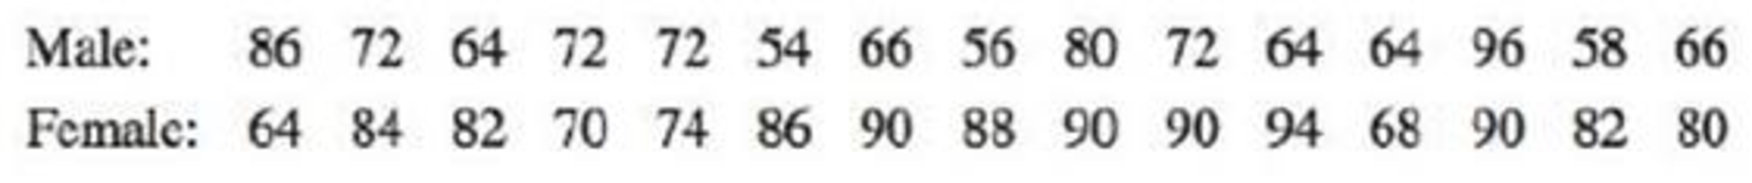
23. Pulse Rates Listed below are pulse rates (beats per minute) from samples of adult males and females (from Data Set 1 “Body Data” in Appendix B). Does there appear to be a difference?
Expert Solution & Answer
Want to see the full answer?
Check out a sample textbook solution
Students have asked these similar questions
help me with ab please. please handwrite if possible. please don't use AI tools to answer
help me with ab please. please handwrite if possible. please don't use AI tools to answer
help me with abcd please. please handwrite if possible. please don't use AI tools to answer
Chapter 3 Solutions
Elementary Statistics, Books A La Carte Edition (13th Edition)
Ch. 3.1 - Average The defunct website IncomeTaxList.com...Ch. 3.1 - Whats Wrong? USA Today published a list consisting...Ch. 3.1 - Measures of Center In what sense are the mean,...Ch. 3.1 - Resistant Measures Here are four of the Verizon...Ch. 3.1 - Critical Thinking. For Exercises 5-20, watch out...Ch. 3.1 - Critical Thinking. For Exercises 5-20, watch out...Ch. 3.1 - Critical Thinking. For Exercises 5-20, watch out...Ch. 3.1 - Critical Thinking. For Exercises 5-20, watch out...Ch. 3.1 - Critical Thinking. For Exercises 5-20, watch out...Ch. 3.1 - Critical Thinking. For Exercises 5-20, watch out...
Ch. 3.1 - Critical Thinking. For Exercises 5-20, watch out...Ch. 3.1 - Critical Thinking. For Exercises 5-20, watch out...Ch. 3.1 - Critical Thinking. For Exercises 5-20, watch out...Ch. 3.1 - Critical Thinking. For Exercises 5-20, watch out...Ch. 3.1 - Critical Thinking. For Exercises 5-20, watch out...Ch. 3.1 - Critical Thinking. For Exercises 5-20, watch out...Ch. 3.1 - Critical Thinking. For Exercises 5-20, watch out...Ch. 3.1 - Critical Thinking. For Exercises 5-20, watch out...Ch. 3.1 - Critical Thinking. For Exercises 5-20, watch out...Ch. 3.1 - Critical Thinking. For Exercises 5-20, watch out...Ch. 3.1 - In Exercises 21-24, find the mean and median for...Ch. 3.1 - In Exercises 21-24, find the mean and median for...Ch. 3.1 - In Exercises 21-24, find the mean and median for...Ch. 3.1 - In Exercises 21-24, find the mean and median for...Ch. 3.1 - Large Data Sets from Appendix B. In Exercises...Ch. 3.1 - Large Data Sets from Appendix B. In Exercises...Ch. 3.1 - Large Data Sets from Appendix B. In Exercises...Ch. 3.1 - Large Data Sets from Appendix B. In Exercises...Ch. 3.1 - In Exercises 29-32, find the mean of the data...Ch. 3.1 - In Exercises 29-32, find the mean of the data...Ch. 3.1 - In Exercises 29-32, find the mean of the data...Ch. 3.1 - In Exercises 29-32, find the mean of the data...Ch. 3.1 - Weighted Mean A student of the author earned...Ch. 3.1 - Weighted Mean A student of the author earned...Ch. 3.1 - Degrees of Freedom Five pulse rates randomly...Ch. 3.1 - Censored Data Data Set 15 Presidents in Appendix B...Ch. 3.1 - Trimmed Mean Because the mean is very sensitive to...Ch. 3.1 - Harmonic Mean The harmonic mean is often used as a...Ch. 3.1 - Geometric Mean The geometric mean is often used in...Ch. 3.1 - Quadratic Mean The quadratic mean (or root mean...Ch. 3.1 - Median When data are summarized in a frequency...Ch. 3.2 - Range Rule of Thumb for Estimating s The 20 brain...Ch. 3.2 - Range Rule of Thumb for Interpreting s The 20...Ch. 3.2 - Variance The 20 subjects used in Data Set 8 IQ and...Ch. 3.2 - Symbols Identify the symbols used for each of the...Ch. 3.2 - In Exercises 5-20, find the range, variance, and...Ch. 3.2 - In Exercises 5-20, find the range, variance, and...Ch. 3.2 - In Exercises 5-20, find the range, variance, and...Ch. 3.2 - In Exercises 5-20, find the range, variance, and...Ch. 3.2 - In Exercises 5-20, find the range, variance, and...Ch. 3.2 - In Exercises 5-20, find the range, variance, and...Ch. 3.2 - In Exercises 5-20, find the range, variance, and...Ch. 3.2 - In Exercises 5-20, find the range, variance, and...Ch. 3.2 - In Exercises 5-20, find the range, variance, and...Ch. 3.2 - In Exercises 5-20, find the range, variance, and...Ch. 3.2 - In Exercises 5-20, find the range, variance, and...Ch. 3.2 - In Exercises 5-20, find the range, variance, and...Ch. 3.2 - In Exercises 5-20, find the range, variance, and...Ch. 3.2 - In Exercises 5-20, find the range, variance, and...Ch. 3.2 - In Exercises 5-20, find the range, variance, and...Ch. 3.2 - In Exercises 5-20, find the range, variance, and...Ch. 3.2 - In Exercises 21-24, find the coefficient of...Ch. 3.2 - In Exercises 21-24, find the coefficient of...Ch. 3.2 - In Exercises 21-24, find the coefficient of...Ch. 3.2 - In Exercises 21-24, find the coefficient of...Ch. 3.2 - Large Data Sets from Appendix B. In Exercises...Ch. 3.2 - Prob. 26BSCCh. 3.2 - Large Data Sets from Appendix B. In Exercises...Ch. 3.2 - Large Data Sets from Appendix B. In Exercises...Ch. 3.2 - Estimating Standard Deviation with the Range Rule...Ch. 3.2 - Prob. 30BSCCh. 3.2 - Estimating Standard Deviation with the Range Rule...Ch. 3.2 - Estimating Standard Deviation with the Range Rule...Ch. 3.2 - Identifying Significant Values with the Range Rule...Ch. 3.2 - Prob. 34BSCCh. 3.2 - Foot Lengths Based on Data Set 2 Foot and Height...Ch. 3.2 - Identifying Significant Values with the Range Rule...Ch. 3.2 - Finding Standard Deviation from a Frequency...Ch. 3.2 - Finding Standard Deviation from a Frequency...Ch. 3.2 - Finding Standard Deviation from a Frequency...Ch. 3.2 - Finding Standard Deviation from a Frequency...Ch. 3.2 - The Empirical Rule Based on Data Set 1 Body Data...Ch. 3.2 - The Empirical Rule Based on Data Set 3 Body...Ch. 3.2 - Chebyshevs Theorem Based on Data Set 1 Body Data...Ch. 3.2 - Chebyshevs Theorem Based on Data Set 3 Body...Ch. 3.2 - Why Divide by n 1? Let a population consist of...Ch. 3.2 - Mean Absolute Deviation Use the same population of...Ch. 3.3 - z Scores LeBron James, one of the most successful...Ch. 3.3 - Heights The boxplot shown below results from the...Ch. 3.3 - Boxplot Comparison Refer to the boxplots shown...Ch. 3.3 - z Scores If your score on your next statistics...Ch. 3.3 - z Scores. In Exercises 5-8, express all z scores...Ch. 3.3 - z Scores. In Exercises 5-8, express all z scores...Ch. 3.3 - z Scores. In Exercises 5-8, express all z scores...Ch. 3.3 - z Scores. In Exercises 5-8, express all z scores...Ch. 3.3 - Significant Values. In Exercises 9-12, consider a...Ch. 3.3 - Significant Values. In Exercises 9-12, consider a...Ch. 3.3 - Significant Values. In Exercises 9-12, consider a...Ch. 3.3 - Significant Values. In Exercises 9-12, consider a...Ch. 3.3 - Comparing Values. In Exercises 13-16, use z scores...Ch. 3.3 - Comparing Values. In Exercises 13-16, use z scores...Ch. 3.3 - Comparing Values. In Exercises 13-16, use z scores...Ch. 3.3 - Comparing Values. In Exercises 13-16, use z scores...Ch. 3.3 - Percentiles. In Exercises 17-20, use the following...Ch. 3.3 - Percentiles. In Exercises 17-20, use the following...Ch. 3.3 - Percentiles. In Exercises 17-20, use the following...Ch. 3.3 - Percentiles. In Exercises 17-20, use the following...Ch. 3.3 - Percentiles. In Exercises 17-20, use the following...Ch. 3.3 - Percentiles. In Exercises 17-20, use the following...Ch. 3.3 - Percentiles. In Exercises 17-20, use the following...Ch. 3.3 - Percentiles. In Exercises 17-20, use the following...Ch. 3.3 - Percentiles. In Exercises 17-20, use the following...Ch. 3.3 - Percentiles. In Exercises 17-20, use the following...Ch. 3.3 - Percentiles. In Exercises 17-20, use the following...Ch. 3.3 - Percentiles. In Exercises 17-20, use the following...Ch. 3.3 - Boxplots. In Exercises 29-32, use the given data...Ch. 3.3 - Boxplots. In Exercises 29-32, use the given data...Ch. 3.3 - Boxplots. In Exercises 29-32, use the given data...Ch. 3.3 - Boxplots. In Exercises 29-32, use the given data...Ch. 3.3 - Boxplots from Large Data Sets in Appendix B. In...Ch. 3.3 - Boxplots from Large Data Sets in Appendix B. In...Ch. 3.3 - Prob. 35BSCCh. 3.3 - Boxplots from Large Data Sets in Appendix B. In...Ch. 3.3 - Outliers and Modified Boxplots Repeat Exercise 33...Ch. 3 - Sleep Mean As part of the National Health and...Ch. 3 - Sleep Median What is the median of the sample...Ch. 3 - Sleep Mode What is the mode of the sample values...Ch. 3 - Sleep Variance The standard deviation of the...Ch. 3 - Prob. 5CQQCh. 3 - Sleep z Score A larger sample of 50 sleep times...Ch. 3 - Sleep Q3 For a sample of 80 sleep times,...Ch. 3 - Sleep 5-Number Summary For a sample of 100 sleep...Ch. 3 - Estimating s A large sample of sleep times...Ch. 3 - Sleep Notation Consider a sample of sleep times...Ch. 3 - Old Faithful Geyser Listed below are prediction...Ch. 3 - z Score Using the sample data from Exercise 1,...Ch. 3 - Boxplot Using the same prediction errors listed in...Ch. 3 - ER Codes In an analysis of activities that...Ch. 3 - Comparing Birth Weights The birth weights of a...Ch. 3 - Effects of an Outlier Listed below are platelet...Ch. 3 - Interpreting a Boxplot Shown below is a boxplot of...Ch. 3 - Estimating Standard Deviation Listed below is a...Ch. 3 - Prob. 1CRECh. 3 - Prob. 2CRECh. 3 - Stemplot Use the amounts of arsenic from Exercise...Ch. 3 - Prob. 4CRECh. 3 - Histogram The accompanying histogram depicts...Ch. 3 - Normal Distribution Examine the distribution shown...Ch. 3 - Words Spoken by Men and Women Refer to Data Set 24...Ch. 3 - Second-Hand Smoke Data Set 12 Passive and Active...
Knowledge Booster


Learn more about
Need a deep-dive on the concept behind this application? Look no further. Learn more about this topic, statistics and related others by exploring similar questions and additional content below.Similar questions
- help me with abc please. please handwrite if possible. please don't use AI tools to answerarrow_forwardhelp me with abc please. please handwrite if possible. please don't use AI tools to answerarrow_forwardhelp me with abc please. please handwrite if possible. please don't use AI tools to answer.arrow_forward
- Please help me with this statistics questionarrow_forwardPlease help me with the following statistic questionarrow_forwardTo evaluate the success of a 1-year experimental program designed to increase the mathematical achievement of underprivileged high school seniors, a random sample of participants in the program will be selected and their mathematics scores will be compared with the previous year’s statewide average of 525 for underprivileged seniors. The researchers want to determine whether the experimental program has increased the mean achievement level over the previous year’s statewide average. If alpha=.05, what sample size is needed to have a probability of Type II error of at most .025 if the actual mean is increased to 550? From previous results, sigma=80.arrow_forward
- Please help me answer the following questions from this problem.arrow_forwardPlease help me find the sample variance for this question.arrow_forwardCrumbs Cookies was interested in seeing if there was an association between cookie flavor and whether or not there was frosting. Given are the results of the last week's orders. Frosting No Frosting Total Sugar Cookie 50 Red Velvet 66 136 Chocolate Chip 58 Total 220 400 Which category has the greatest joint frequency? Chocolate chip cookies with frosting Sugar cookies with no frosting Chocolate chip cookies Cookies with frostingarrow_forward
- The table given shows the length, in feet, of dolphins at an aquarium. 7 15 10 18 18 15 9 22 Are there any outliers in the data? There is an outlier at 22 feet. There is an outlier at 7 feet. There are outliers at 7 and 22 feet. There are no outliers.arrow_forwardStart by summarizing the key events in a clear and persuasive manner on the article Endrikat, J., Guenther, T. W., & Titus, R. (2020). Consequences of Strategic Performance Measurement Systems: A Meta-Analytic Review. Journal of Management Accounting Research?arrow_forwardThe table below was compiled for a middle school from the 2003 English/Language Arts PACT exam. Grade 6 7 8 Below Basic 60 62 76 Basic 87 134 140 Proficient 87 102 100 Advanced 42 24 21 Partition the likelihood ratio test statistic into 6 independent 1 df components. What conclusions can you draw from these components?arrow_forward
arrow_back_ios
SEE MORE QUESTIONS
arrow_forward_ios
Recommended textbooks for you
 Big Ideas Math A Bridge To Success Algebra 1: Stu...AlgebraISBN:9781680331141Author:HOUGHTON MIFFLIN HARCOURTPublisher:Houghton Mifflin Harcourt
 Glencoe Algebra 1, Student Edition, 9780079039897...AlgebraISBN:9780079039897Author:CarterPublisher:McGraw Hill
 Holt Mcdougal Larson Pre-algebra: Student Edition...AlgebraISBN:9780547587776Author:HOLT MCDOUGALPublisher:HOLT MCDOUGAL
Big Ideas Math A Bridge To Success Algebra 1: Stu...
Algebra
ISBN:9781680331141
Author:HOUGHTON MIFFLIN HARCOURT
Publisher:Houghton Mifflin Harcourt
Glencoe Algebra 1, Student Edition, 9780079039897...
Algebra
ISBN:9780079039897
Author:Carter
Publisher:McGraw Hill
Holt Mcdougal Larson Pre-algebra: Student Edition...
Algebra
ISBN:9780547587776
Author:HOLT MCDOUGAL
Publisher:HOLT MCDOUGAL
The Shape of Data: Distributions: Crash Course Statistics #7; Author: CrashCourse;https://www.youtube.com/watch?v=bPFNxD3Yg6U;License: Standard YouTube License, CC-BY
Shape, Center, and Spread - Module 20.2 (Part 1); Author: Mrmathblog;https://www.youtube.com/watch?v=COaid7O_Gag;License: Standard YouTube License, CC-BY
Shape, Center and Spread; Author: Emily Murdock;https://www.youtube.com/watch?v=_YyW0DSCzpM;License: Standard Youtube License