Subpart (a):
Effect on Aggregate Demand and Supply.
Subpart (a):
Explanation of Solution
When consumers fear of an impending economic depression, their spending decline and they tend to save more. This leads to a decrease in AD curve. This can be explained by using figure 1.
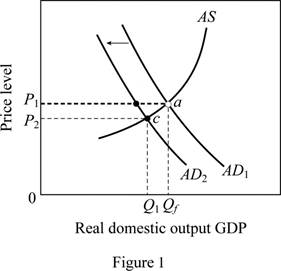
In figure 1, horizontal axis represents the real GDP(
Concept Introduction:
Aggregate demand (AD): Aggregate demand refers to the total value of the goods and services that are demanded at a particular price in a given period of time.
Subpart (b):
Effect on Aggregate Demand and Supply.
Subpart (b):
Explanation of Solution
When a new tax is imposed on producers, cost of production comes up and there is no incentive to produce more. This leads to a decline in
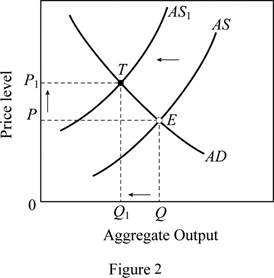
In figure 2, horizontal axis represents the real GDP and vertical axis represents price level. In this case, the AS curve shifts left (from AS to AS1), this moves the equilibrium position from E to T, thus there is a decline in the output (from Q to Q1) and a rise in the price level (from P to P1).
Concept Introduction:
Aggregate demand (AD): Aggregate demand refers to the total value of the goods and services that are demanded at a particular price in a given period of time.
Aggregate supply (AS): Aggregate supply refers to the total value of the goods and services that are available for purchase at a particular price in a given period of time.
Subpart (c):
Effect on Aggregate Demand and Supply.
Subpart (c):
Explanation of Solution
Figure 3 can explain the shift in AD curve due to reduction in interest rates at each price level. In figure 3, horizontal axis measures the real GDP and vertical axis measures the price level.
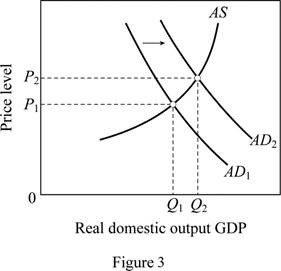
A reduction in interest rates decreases the borrowing cost increases the spending.
This leads to a rightward shift of AD curve from AD1 to AD2. Thus, it brings the output and price level up. The output increases from Q1 to Q2 and price level increases from P1 to P2.
Concept Introduction:
Aggregate demand (AD): Aggregate demand refers to the total value of the goods and services that are demanded at a particular price in a given period of time.
Aggregate supply (AS): Aggregate supply refers to the total value of the goods and services that are available for purchase at a particular price in a given period of time.
Subpart (d):
Effect on Aggregate Demand and Supply.
Subpart (d):
Explanation of Solution
A major increase in spending shifts the AD curve to right. Figure 4 is used to explain this situation. In figure 4, horizontal axis measures the real GDP and vertical axis measures the price level.
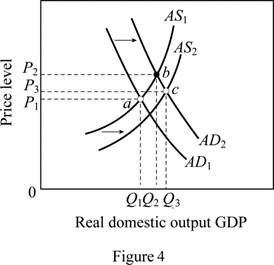
Government expenditure is a key determinant of changes in the aggregate demand. The increase in government spending (spending for health care) increases the aggregate demand leading to a shift of AD curve from AD1 to AD2. Any real improvements in healthcare resulting from the spending would ultimately increase the productivity, thereby shifting the AS curve to the right (from AS1 to AS2). The equilibrium moves from a to c leading to an increase in output (from Q1 to Q3) .It will also move the price level up from P1 to P3.
Concept Introduction:
Aggregate demand (AD): Aggregate demand refers to the total value of the goods and services that are demanded at a particular price in a given period of time.
Aggregate supply (AS): Aggregate supply refers to the total value of the goods and services that are available for purchase at a particular price in a given period of time.
Subpart (e):
Effect on Aggregate Demand and Supply.
Subpart (e):
Explanation of Solution
The general expectation of surging inflation in the near future will increase the aggregate demand today because the consumers will want to buy products before their prices escalate. This can be illustrated using figure 3. As a result, there will be a rightward shift of AD curve from AD1 to AD2 which brings the output and price level up. In figure 3, the output increases from Q1 to Q2 and price level increases from P1 to P2.
Concept Introduction:
Aggregate demand (AD): Aggregate demand refers to the total value of the goods and services that are demanded at a particular price in a given period of time.
Aggregate supply (AS): Aggregate supply refers to the total value of the goods and services that are available for purchase at a particular price in a given period of time.
Subpart (f):
Effect on Aggregate Demand and Supply.
Subpart (f):
Explanation of Solution
Figure 5 is used to explain this case. In figure 5, horizontal axis measures the real GDP and vertical axis measures the price level.
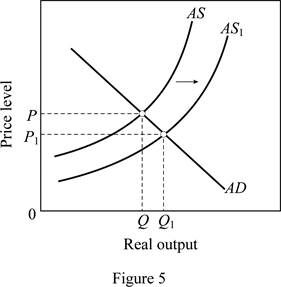
As oil prices fall (oil is an imported resource) due to the disintegration of OPEC, it increases the U.S. aggregate supply. As a result, there will be a rightward shift of AS curve from AS to AS1. This brings the output level up from Q to Q1 and price level down from P to P1.
Concept Introduction:
Aggregate demand (AD): Aggregate demand refers to the total value of the goods and services that are demanded at a particular price in a given period of time.
Aggregate supply (AS): Aggregate supply refers to the total value of the goods and services that are available for purchase at a particular price in a given period of time.
Subpart (g):
Effect on Aggregate Demand and Supply.
Subpart (g):
Explanation of Solution
A reduction in the personal income tax rates raises take-home income increases consumer purchases at each possible price level. This is illustrated in figure 3. Tax cuts shift the aggregate demand curve to the right from AD1 to AD2 which brings the output and price level up. In figure 3, the output increases from Q1 to Q2 and price level increases from P1 to P2.
Concept Introduction:
Aggregate demand (AD): Aggregate demand refers to the total value of the goods and services that are demanded at a particular price in a given period of time.
Aggregate supply (AS): Aggregate supply refers to the total value of the goods and services that are available for purchase at a particular price in a given period of time.
Subpart (h):
Effect on Aggregate Demand and Supply.
Subpart (h):
Explanation of Solution
The sizable increase the labor productivity with no change in nominal wages will increase the overall productivity as more output is available for the given input. This increases the aggregate supply thereby shifting the AS curve to the right from AS to AS1 (Refer Figure 5). This leads to an increase in output (from Q to Q1) and a decrease in price level from P to P1.
Concept Introduction:
Aggregate demand (AD): Aggregate demand refers to the total value of the goods and services that are demanded at a particular price in a given period of time.
Aggregate supply (AS): Aggregate supply refers to the total value of the goods and services that are available for purchase at a particular price in a given period of time.
Subpart (i):
Effect on Aggregate Demand and Supply.
Subpart (i):
Explanation of Solution
This case can be explained using Figure 2. When there is an increase in nominal wages with no change in productivity, it increases per unit cost of production. This force the AS curve to shift left (from AS to AS1). The equilibrium position moves from E to T, thus there are a decline in the output (from Q to Q1) and a rise in the price level (from P to P1).
Concept Introduction:
Aggregate demand (AD): Aggregate demand refers to the total value of the goods and services that are demanded at a particular price in a given period of time.
Aggregate supply (AS): Aggregate supply refers to the total value of the goods and services that are available for purchase at a particular price in a given period of time.
Subpart (j):
Effect on Aggregate Demand and Supply.
Subpart (j):
Explanation of Solution
Figure 6 shows the impact of increasing demand and decreasing supply.
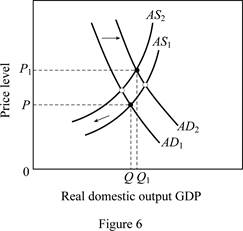
Figure 6 is used to explain this condition. The horizontal axis in Figure 6 measures the real domestic output whereas price level is measured by the vertical axis. A rise in net exports (higher exports relative to imports) shifts the aggregate demand curve to the right (from AD1 to AD2). But, due to the higher input prices, per unit cost is more, leading to a shift of the aggregate supply curve to the left from AS1 to AS2. This leads to an increase in output from Q to Q1 along with an increase in price level from P to P1.
Concept Introduction:
Aggregate demand (AD): Aggregate demand refers to the total value of the goods and services that are demanded at a particular price in a given period of time.
Aggregate supply (AS): Aggregate supply refers to the total value of the goods and services that are available for purchase at a particular price in a given period of time.
Want to see more full solutions like this?
Chapter 30 Solutions
EBK ECONOMICS

- 6. Rent seeking The following graph shows the demand, marginal revenue, and marginal cost curves for a single-price monopolist that produces a drug that helps relieve arthritis pain. Place the grey point (star symbol) in the appropriate location on the graph to indicate the monopoly outcome such that the dashed lines reveal the profit-maximizing price and quantity of a single-price monopolist. Then, use the green rectangle (triangle symbols) to show the profits earned by the monopolist. 18 200 20 16 16 14 PRICE (Dollars per dose) 12 10 10 8 4 2 MC = ATC MR Demand 0 0 5 10 15 20 25 30 35 40 45 50 QUANTITY (Millions of doses per year) Monopoly Outcome Monopoly Profits Suppose that should the patent on this particular drug expire, the market would become perfectly competitive, with new firms immediately entering the market with essentially identical products. Further suppose that in this case the original firm will hire lobbyists and make donations to several key politicians to extend its…arrow_forwardConsider a call option on a stock that does not pay dividends. The stock price is $100 per share, and the risk-free interest rate is 10%. The call strike is $100 (at the money). The stock moves randomly with u=2 and d=0.5. 1. Write the system of equations to replicate the option using A shares and B bonds. 2. Solve the system of equations and determine the number of shares and the number of bonds needed to replicate the option. Show your answer with 4 decimal places (x.xxxx); do not round intermediate calculations. This is easy to do in Excel. A = B = 3. Use A shares and B bonds from the prior question to calculate the premium on the option. Again, do not round intermediate calculations and show your answer with 4 decimal places. Call premium =arrow_forwardAnswer these questions using replication or the risk neutral probability. Both methods will produce the same answer. Show your work to receive credit. 6. What is the premium of a call with a higher strike. Show your work to receive credit; do not round intermediate calculations. S0 = $100, u=2, d=0.5, r=10%, strike=$150arrow_forward
- Answer these questions using replication or the risk neutral probability. Both methods will produce the same answer.arrow_forwardProblem 2: At a raffle, 2000 tickets are sold at $5 each for five prizes of $2000, $1000, $500, $250, and $100. You buy one ticket. What is the expected value of your gain? 1. Find the gain for each prize. 2. Write a probability distribution for the possible gains. 3. Find the expected value. 4. Interpret the results.arrow_forwardThis activity focuses on developing direct and supported opinions using various sources of information on the importance of the following topics: non-renewable and renewable energies, economic factors and obstacles that can affect the relationship between international trade and economic growth, devaluation of the currency in countries, and the imbalance of economic equity. In this context, it is essential that, when studying and developing these topics, students understand the concepts of the value of currencies and that leads to devaluation, non-renewable and renewable energy resources, economic development and obstacles, distribution of wealth, economic growth and external and internal constraints, and about international trade as a growth factor. Thus, the objectives that are intended to be achieved are the following: Acquire knowledge about the concepts mentioned above. Determine relationships between economic growth and international trade. Understand what some limitations that…arrow_forward
- Consider a firm facing conventional production technology. The short run Production Function has a small range of increasing marginal product (increasing marginal returns) and then is subject to the Law of Diminishing Marginal Product (diminishing marginal returns). A. Putting quantity on the horizontal axis and dollars on the vertical axis, depict three important curves: Fixed Cost (FC), Variable Cost (VC), and Total Cost (TC). (Note that we are not asking you to depict average cost functions!) B. Please clearly indicate on this graph the range of quantities where the firm is experiencing (1) increasing marginal product and (2) diminishing marginal product. C. In a few sentences, please justify why you've made this specific classification of increasing/diminishing marginal product in part (b).arrow_forwardplease answer the following questions: What is money, and why does anyone want it? Explain the concept of the opportunity cost of holding money . Explain why an increase in U.S. interest rates relative to UK interest rates would affect the U.S.-UK exchange rate. Suppose that a person’s wealth is $50,000 and that her yearlyincome is $60,000. Also suppose that her money demand functionis given by Md = $Y10.35 - i2Derive the demand for bonds. Suppose the interest rate increases by 10 percentage points. What is the effect on her demand for bonds?b. What are the effects of an increase in income on her demand for money and her demand for bonds? Explain in wordsarrow_forwardDriving Quiz X My Course G city place w x D2L Login - Univ X D2L Login - Univ x D2L Login - U acmillanlearning.com/ihub/assessment/f188d950-dd73-11e0-9572-0800200c9a66/4db68a5e-69bb-4767-8d6c-a12d +1687 pts /1800 © Macmillan Learning Question 6 of 18 > The graph shows the average total cost (ATC) curve, the marginal cost (MC) curve, the average variable cost (AVC) curve, and the marginal revenue (MR) curve (which is also the market price) for a perfectly competitive firm that produces terrible towels. Answer the three questions, assuming that the firm is profit-maximizing and does not shut down in the short run. What is the firm's total revenue? S What is the firm's total cost? $ What is the firm's profit? (Enter a negative number for a loss.) $ Price $320 $300 $200 $150 205 260 336 365 Quantity MC ATC AVC MR=Parrow_forward
- 1. Suppose that the two nations face the following benefits of pollution, B, and costs of abatement, C: BN = 10, Bs = 7; CN = 5, Cs = 4. Further assume that if the nation chooses to abate pollution, it still receives the benefits of pollution but now must pay the cost of abatement as well. a. Identify the payoffs that accrue to each nation under the four different possible outcomes of the game and present these payoffs in the normal form of the game. b. Recall that the term dominant strategy defines the condition that a player in a game would prefer to play that strategy (in this case either pollute or abate) regardless of the strategy chosen by the other player in the game. Does either nation have a dominant strategy in this game? If so, what is it? c. Identify the Nash equilibria, or non-cooperative equilibria, of this game.arrow_forwardagrody calming Inted 001 and me 2. A homeowner is concerned about the various air pollutants (e.g., benzene and methane) released in her house when she cooks with natural gas. She is considering replacing her gas oven and stove with an electric stove comprising an induction cooktop and convection oven. The new appliance costs $900 to purchase and install. Capping the old gas line costs an additional $150 (a one-time fee). The old line must be inspected for leaks each year after capping, at a cost of $35 for each inspection. a. If the homeowner plans to remain in the house for four more years and the discount rate is 4%, what is the minimum present value of the benefits that the homeowner would need to experience for this purchase to be justified based on its private net sub present value? b. While trying to understand how she might express the value of reduced exposure to indoor air pollutants in dollar terms, the homeowner consulted the EPA website and found estimates provided by…arrow_forwardAfter the ban is imposed, Joe’s firm switches to the more expensive biodegradable disposable cups. This increases the cost associated with each cup of coffee it produces. Which cost curve(s) will be impacted by the use of the more expensive biodegradable disposable cups? Why? Which cost curve(s) will not shift, and why not? Please use the table below to answer this question. For the second column (“Impacted? If so, how?”), please use one of the following three choices: No shift; Shifts up (i.e., increases: at nearly any given quantity, the cost goes up); or Shifts down (i.e., decreases: at nearly any given quantity, the cost goes down). $ Cost Curve Impacted? If so, how? Explanation of the Shift: Why or Why Not AFC No shift. Fix costs stay the same, regardless of quantity. Fixed cost is calculated as Fixed Cost/Quantity. Since fixed costs remain unchanged, AFC stays the same for each quantity. MC Shifts up. Since the biodegradable cups are more expensive, the…arrow_forward
 Essentials of Economics (MindTap Course List)EconomicsISBN:9781337091992Author:N. Gregory MankiwPublisher:Cengage Learning
 Principles of Economics (MindTap Course List)EconomicsISBN:9781305585126Author:N. Gregory MankiwPublisher:Cengage Learning
 Principles of Macroeconomics (MindTap Course List)EconomicsISBN:9781285165912Author:N. Gregory MankiwPublisher:Cengage Learning
 Brief Principles of Macroeconomics (MindTap Cours...EconomicsISBN:9781337091985Author:N. Gregory MankiwPublisher:Cengage Learning
 Principles of Economics, 7th Edition (MindTap Cou...EconomicsISBN:9781285165875Author:N. Gregory MankiwPublisher:Cengage Learning
 Principles of Macroeconomics (MindTap Course List)EconomicsISBN:9781305971509Author:N. Gregory MankiwPublisher:Cengage Learning