
To answer:
What is a competitive market and how it is described by the
Concept Introduction:
Competitive market: The competitive market is a market where there is large number of buyers and sellers in the, the sellers are profit motive and the buyers want to maximise their satisfaction. In a competitive market no single produce can influence the price of the commodities. If one producer increases the price of his good no one will follow him and the producer may incur losses. In a
Explanation:
The competitive market is a place where there are large number of buyers and sellers in the economy. And they are selling homogenous products in the economy. The sellers are profit oriented and the buyers want maximum satisfaction from the products. There is rivalry in the competitive market the actions of one firm affects the decision of another firm so it leads to rivalry in the markets.
Another feature of competitive market is excludability. The firms may exclude the consumers from enjoying their goods or service for an example the movies are only shown to the persons who buy movie tickets, if there is no excludability the consumers become free riders. Another feature of competitive market is the available information is fully reflected in the market for example there is report that hamburger consumption creates more health problems to the people, so due to this report there will be decreased demand for hamburgers in the market. So the available information is fully reflected in the market. The very important feature of competitive market is there is no barriers to entry that means firms can enter and leave the market at any time, there is complete freedom of firms to enter or leave the market.
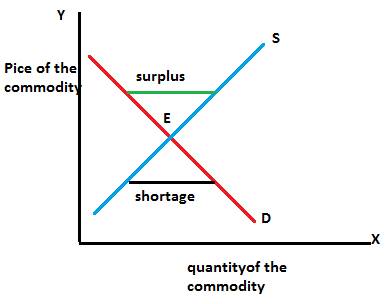
The above graph shows the supply and demand model in a competitive market, the demand curve will be downward sloping one indicates the negative relationship between the price and quantity demanded, if the prices are high the people will buy less of the product. The supply curve will be upward sloping one indicates the direct relationship between demand and supply. If the prices are high the producers will supply more of their products in the market. The intersection between the demand and supply curve is the equilibrium where the demand and supply are equal. There will be a surplus in the economy when the supply of goods and services exceeds the demand for goods and services and there will be also shortages in the economy when there is demand for goods and services exceeds the supply of goods and services.
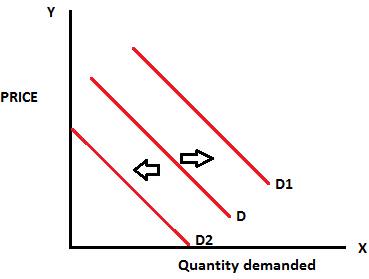
The shifts in the demand curve is shown by the above graph, a right ward shift from D to D1 shows increase in the quantity demanded of the commodity and the left ward shift from D to D2 shows the decrease in the quantity demanded. Changes in the price of commodity can only create movement along the demand curve and it cannot shift the demand curve, changes in income, tastes and preferences, fashion, changes in the prices of other goods can shift the demand curve.
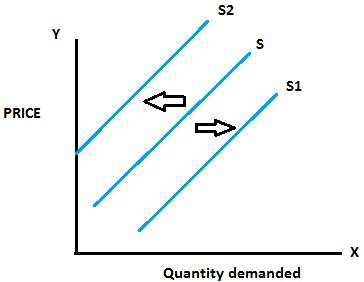
The shifts in the supply curve is shown by the above graph a right ward shift from S to S1 shows the increase in the quantity supplied and a leftward shift from S to S2 shows the decrease in the quantity supplied. Changes in input prices, expectations, technology can shift the supply curve; price only can result in a movement in the supply curve.
Explanation of Solution
The competitive market is a place where there are large number of buyers and sellers in the economy. And they are selling homogenous products in the economy. The sellers are profit oriented and the buyers want maximum satisfaction from the products. There is rivalry in the competitive market the actions of one firm affects the decision of another firm so it leads to rivalry in the markets.
Another feature of competitive market is excludability. The firms may exclude the consumers from enjoying their goods or service for an example the movies are only shown to the persons who buy movie tickets, if there is no excludability the consumers become free riders. Another feature of competitive market is the available information is fully reflected in the market for example there is report that hamburger consumption creates more health problems to the people, so due to this report there will be decreased
The above graph shows the supply and demand model in a competitive market, the demand curve will be downward sloping one indicates the negative relationship between the price and quantity demanded, if the prices are high the people will buy less of the product. The supply curve will be upward sloping one indicates the direct relationship between demand and supply. If the prices are high the producers will supply more of their products in the market. The intersection between the demand and supply curve is the equilibrium where the demand and supply are equal. There will be a surplus in the economy when the supply of goods and services exceeds the demand for goods and services and there will be also shortages in the economy when there is demand for goods and services exceeds the supply of goods and services.
The shifts in the demand curve is shown by the above graph, a right ward shift from D to D1 shows increase in the quantity demanded of the commodity and the left ward shift from D to D2 shows the decrease in the quantity demanded. Changes in the price of commodity can only create movement along the demand curve and it cannot shift the demand curve, changes in income, tastes and preferences, fashion, changes in the prices of other goods can shift the demand curve.
The shifts in the supply curve is shown by the above graph a right ward shift from S to S1 shows the increase in the quantity supplied and a leftward shift from S to S2 shows the decrease in the quantity supplied. Changes in input prices, expectations, technology can shift the supply curve; price only can result in a movement in the supply curve.
Want to see more full solutions like this?

- simple steps on how it should look like on excelarrow_forwardConsider options on a stock that does not pay dividends.The stock price is $100 per share, and the risk-free interest rate is 10%.Thestock moves randomly with u=1.25and d=1/u Use Excel to calculate the premium of a10-year call with a strike of $100.arrow_forwardCompute the Fourier sine and cosine transforms of f(x) = e.arrow_forward
- 17. Given that C=$700+0.8Y, I=$300, G=$600, what is Y if Y=C+I+G?arrow_forwardUse the Feynman technique throughout. Assume that you’re explaining the answer to someone who doesn’t know the topic at all. Write explanation in paragraphs and if you use currency use USD currency: 10. What is the mechanism or process that allows the expenditure multiplier to “work” in theKeynesian Cross Model? Explain and show both mathematically and graphically. What isthe underpinning assumption for the process to transpire?arrow_forwardUse the Feynman technique throughout. Assume that you’reexplaining the answer to someone who doesn’t know the topic at all. Write it all in paragraphs: 2. Give an overview of the equation of exchange (EoE) as used by Classical Theory. Now,carefully explain each variable in the EoE. What is meant by the “quantity theory of money”and how is it different from or the same as the equation of exchange?arrow_forward
- Zbsbwhjw8272:shbwhahwh Zbsbwhjw8272:shbwhahwh Zbsbwhjw8272:shbwhahwhZbsbwhjw8272:shbwhahwhZbsbwhjw8272:shbwhahwharrow_forwardUse the Feynman technique throughout. Assume that you’re explaining the answer to someone who doesn’t know the topic at all:arrow_forwardUse the Feynman technique throughout. Assume that you’reexplaining the answer to someone who doesn’t know the topic at all: 4. Draw a Keynesian AD curve in P – Y space and list the shift factors that will shift theKeynesian AD curve upward and to the right. Draw a separate Classical AD curve in P – Yspace and list the shift factors that will shift the Classical AD curve upward and to the right.arrow_forward

 Principles of Economics (12th Edition)EconomicsISBN:9780134078779Author:Karl E. Case, Ray C. Fair, Sharon E. OsterPublisher:PEARSON
 Engineering Economy (17th Edition)EconomicsISBN:9780134870069Author:William G. Sullivan, Elin M. Wicks, C. Patrick KoellingPublisher:PEARSON
 Principles of Economics (MindTap Course List)EconomicsISBN:9781305585126Author:N. Gregory MankiwPublisher:Cengage Learning
 Managerial Economics: A Problem Solving ApproachEconomicsISBN:9781337106665Author:Luke M. Froeb, Brian T. McCann, Michael R. Ward, Mike ShorPublisher:Cengage Learning
 Managerial Economics & Business Strategy (Mcgraw-...EconomicsISBN:9781259290619Author:Michael Baye, Jeff PrincePublisher:McGraw-Hill Education