
To answer:
What is a competitive market and how it is described by the
Concept Introduction:
Competitive market: The competitive market is a market where there is large number of buyers and sellers in the, the sellers are profit motive and the buyers want to maximise their satisfaction. In a competitive market no single produce can influence the price of the commodities. If one producer increases the price of his good no one will follow him and the producer may incur losses. In a
Explanation:
The competitive market is a place where there are large number of buyers and sellers in the economy. And they are selling homogenous products in the economy. The sellers are profit oriented and the buyers want maximum satisfaction from the products. There is rivalry in the competitive market the actions of one firm affects the decision of another firm so it leads to rivalry in the markets.
Another feature of competitive market is excludability. The firms may exclude the consumers from enjoying their goods or service for an example the movies are only shown to the persons who buy movie tickets, if there is no excludability the consumers become free riders. Another feature of competitive market is the available information is fully reflected in the market for example there is report that hamburger consumption creates more health problems to the people, so due to this report there will be decreased demand for hamburgers in the market. So the available information is fully reflected in the market. The very important feature of competitive market is there is no barriers to entry that means firms can enter and leave the market at any time, there is complete freedom of firms to enter or leave the market.
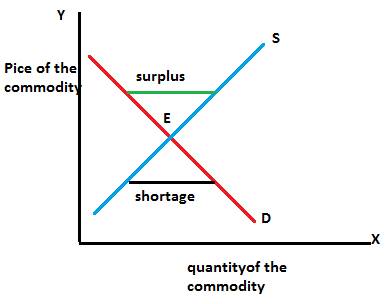
The above graph shows the supply and demand model in a competitive market, the demand curve will be downward sloping one indicates the negative relationship between the price and quantity demanded, if the prices are high the people will buy less of the product. The supply curve will be upward sloping one indicates the direct relationship between demand and supply. If the prices are high the producers will supply more of their products in the market. The intersection between the demand and supply curve is the equilibrium where the demand and supply are equal. There will be a surplus in the economy when the supply of goods and services exceeds the demand for goods and services and there will be also shortages in the economy when there is demand for goods and services exceeds the supply of goods and services.
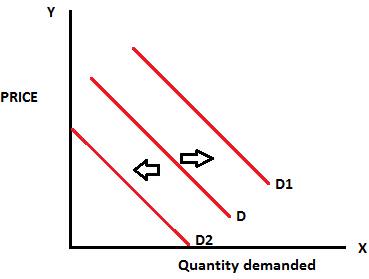
The shifts in the demand curve is shown by the above graph, a right ward shift from D to D1 shows increase in the quantity demanded of the commodity and the left ward shift from D to D2 shows the decrease in the quantity demanded. Changes in the price of commodity can only create movement along the demand curve and it cannot shift the demand curve, changes in income, tastes and preferences, fashion, changes in the prices of other goods can shift the demand curve.
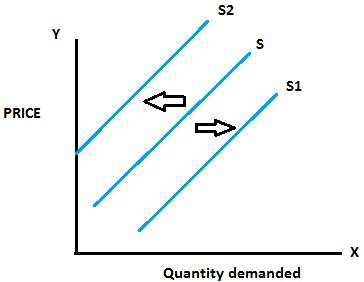
The shifts in the supply curve is shown by the above graph a right ward shift from S to S1 shows the increase in the quantity supplied and a leftward shift from S to S2 shows the decrease in the quantity supplied. Changes in input prices, expectations, technology can shift the supply curve; price only can result in a movement in the supply curve.
Explanation of Solution
The competitive market is a place where there are large number of buyers and sellers in the economy. And they are selling homogenous products in the economy. The sellers are profit oriented and the buyers want maximum satisfaction from the products. There is rivalry in the competitive market the actions of one firm affects the decision of another firm so it leads to rivalry in the markets.
Another feature of competitive market is excludability. The firms may exclude the consumers from enjoying their goods or service for an example the movies are only shown to the persons who buy movie tickets, if there is no excludability the consumers become free riders. Another feature of competitive market is the available information is fully reflected in the market for example there is report that hamburger consumption creates more health problems to the people, so due to this report there will be decreased
The above graph shows the supply and demand model in a competitive market, the demand curve will be downward sloping one indicates the negative relationship between the price and quantity demanded, if the prices are high the people will buy less of the product. The supply curve will be upward sloping one indicates the direct relationship between demand and supply. If the prices are high the producers will supply more of their products in the market. The intersection between the demand and supply curve is the equilibrium where the demand and supply are equal. There will be a surplus in the economy when the supply of goods and services exceeds the demand for goods and services and there will be also shortages in the economy when there is demand for goods and services exceeds the supply of goods and services.
The shifts in the demand curve is shown by the above graph, a right ward shift from D to D1 shows increase in the quantity demanded of the commodity and the left ward shift from D to D2 shows the decrease in the quantity demanded. Changes in the price of commodity can only create movement along the demand curve and it cannot shift the demand curve, changes in income, tastes and preferences, fashion, changes in the prices of other goods can shift the demand curve.
The shifts in the supply curve is shown by the above graph a right ward shift from S to S1 shows the increase in the quantity supplied and a leftward shift from S to S2 shows the decrease in the quantity supplied. Changes in input prices, expectations, technology can shift the supply curve; price only can result in a movement in the supply curve.
Want to see more full solutions like this?

- Use a game tree to illustrate why an aircraft manufacturer may price below the current marginal cost in the short run if it has a steep learning curve. (Hint: Show that learning by doing lowers its cost in the second period.) Part 2 Assume for simplicity the game tree is illustrated in the figure to the right. Pricing below marginal cost reduces profits but gives the incumbent a cost advantage over potential rivals. What is the subgame perfect Nash equilibrium?arrow_forwardAnswerarrow_forwardM” method Given the following model, solve by the method of “M”. (see image)arrow_forward
- As indicated in the attached image, U.S. earnings for high- and low-skill workers as measured by educational attainment began diverging in the 1980s. The remaining questions in this problem set use the model for the labor market developed in class to walk through potential explanations for this trend. 1. Assume that there are just two types of workers, low- and high-skill. As a result, there are two labor markets: supply and demand for low-skill workers and supply and demand for high-skill workers. Using two carefully drawn labor-market figures, show that an increase in the demand for high skill workers can explain an increase in the relative wage of high-skill workers. 2. Using the same assumptions as in the previous question, use two carefully drawn labor-market figures to show that an increase in the supply of low-skill workers can explain an increase in the relative wage of high-skill workers.arrow_forwardPublished in 1980, the book Free to Choose discusses how economists Milton Friedman and Rose Friedman proposed a one-sided view of the benefits of a voucher system. However, there are other economists who disagree about the potential effects of a voucher system.arrow_forwardThe following diagram illustrates the demand and marginal revenue curves facing a monopoly in an industry with no economies or diseconomies of scale. In the short and long run, MC = ATC. a. Calculate the values of profit, consumer surplus, and deadweight loss, and illustrate these on the graph. b. Repeat the calculations in part a, but now assume the monopoly is able to practice perfect price discrimination.arrow_forward

 Principles of Economics (12th Edition)EconomicsISBN:9780134078779Author:Karl E. Case, Ray C. Fair, Sharon E. OsterPublisher:PEARSON
 Engineering Economy (17th Edition)EconomicsISBN:9780134870069Author:William G. Sullivan, Elin M. Wicks, C. Patrick KoellingPublisher:PEARSON
 Principles of Economics (MindTap Course List)EconomicsISBN:9781305585126Author:N. Gregory MankiwPublisher:Cengage Learning
 Managerial Economics: A Problem Solving ApproachEconomicsISBN:9781337106665Author:Luke M. Froeb, Brian T. McCann, Michael R. Ward, Mike ShorPublisher:Cengage Learning
 Managerial Economics & Business Strategy (Mcgraw-...EconomicsISBN:9781259290619Author:Michael Baye, Jeff PrincePublisher:McGraw-Hill Education