Elementary Statistics Plus MyLab Statistics with Pearson eText -- Title-Specific Access Card Package (13th Edition)
13th Edition
ISBN: 9780134763705
Author: Mario F. Triola
Publisher: PEARSON
expand_more
expand_more
format_list_bulleted
Videos
Textbook Question
Chapter 3, Problem 7RE
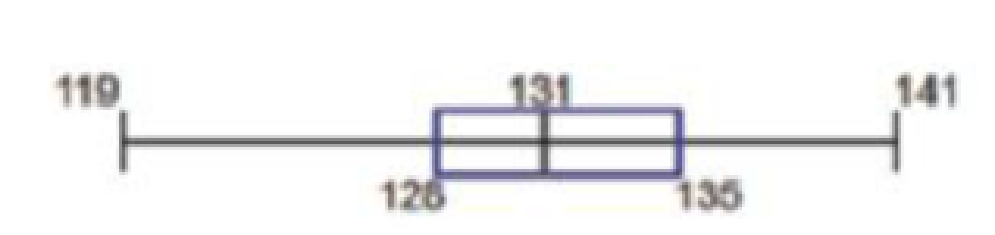
Interpreting a Boxplot Shown below is a boxplot of a sample of 30 maximal skull breadths (mm) measured from Egyptian skulls from around 4000 B.C. What do the numbers in the box- plot represent?
Expert Solution & Answer
Want to see the full answer?
Check out a sample textbook solution
Students have asked these similar questions
1)
and
let Xt is stochastic process with WSS
and Rxlt t+t)
1) E (X5) = \ 1
2
Show that
E (X5 = X 3 = 2 (= = =)
Since X is WSSEL
2
3) find E(X5+ X3)²
4) sind E(X5+X2) J=1
***
Prove that
1) | RxX (T) | << = (R₁ " + R$)
2) find Laplalse trans.
of Normal dis:
3) Prove thy t
/Rx (z) | < | Rx (0)\
4) show that evary
algebra is algebra
or not.
For each of the time series, construct a line chart of the data and identify the characteristics of the time series (that is, random, stationary, trend, seasonal, or cyclical).
Month Number (Thousands)Dec 1991 65.60Jan 1992 71.60Feb 1992 78.80Mar 1992 111.60Apr 1992 107.60May 1992 115.20Jun 1992 117.80Jul 1992 106.20Aug 1992 109.90Sep 1992 106.00Oct 1992 111.80Nov 1992 84.50Dec 1992 78.60Jan 1993 70.50Feb 1993 74.60Mar 1993 95.50Apr 1993 117.80May 1993 120.90Jun 1993 128.50Jul 1993 115.30Aug 1993 121.80Sep 1993 118.50Oct 1993 123.30Nov 1993 102.30Dec 1993 98.70Jan 1994 76.20Feb 1994 83.50Mar 1994 134.30Apr 1994 137.60May 1994 148.80Jun 1994 136.40Jul 1994 127.80Aug 1994 139.80Sep 1994 130.10Oct 1994 130.60Nov 1994 113.40Dec 1994 98.50Jan 1995 84.50Feb 1995 81.60Mar 1995 103.80Apr 1995 116.90May 1995 130.50Jun 1995 123.40Jul 1995 129.10Aug 1995…
Chapter 3 Solutions
Elementary Statistics Plus MyLab Statistics with Pearson eText -- Title-Specific Access Card Package (13th Edition)
Ch. 3.1 - Average The defunct website IncomeTaxList.com...Ch. 3.1 - Whats Wrong? USA Today published a list consisting...Ch. 3.1 - Measures of Center In what sense are the mean,...Ch. 3.1 - Resistant Measures Here are four of the Verizon...Ch. 3.1 - Critical Thinking. For Exercises 5-20, watch out...Ch. 3.1 - Critical Thinking. For Exercises 5-20, watch out...Ch. 3.1 - Critical Thinking. For Exercises 5-20, watch out...Ch. 3.1 - Critical Thinking. For Exercises 5-20, watch out...Ch. 3.1 - Critical Thinking. For Exercises 5-20, watch out...Ch. 3.1 - Critical Thinking. For Exercises 5-20, watch out...
Ch. 3.1 - Critical Thinking. For Exercises 5-20, watch out...Ch. 3.1 - Critical Thinking. For Exercises 5-20, watch out...Ch. 3.1 - Critical Thinking. For Exercises 5-20, watch out...Ch. 3.1 - Critical Thinking. For Exercises 5-20, watch out...Ch. 3.1 - Critical Thinking. For Exercises 5-20, watch out...Ch. 3.1 - Critical Thinking. For Exercises 5-20, watch out...Ch. 3.1 - Critical Thinking. For Exercises 5-20, watch out...Ch. 3.1 - Critical Thinking. For Exercises 5-20, watch out...Ch. 3.1 - Critical Thinking. For Exercises 5-20, watch out...Ch. 3.1 - Critical Thinking. For Exercises 5-20, watch out...Ch. 3.1 - In Exercises 21-24, find the mean and median for...Ch. 3.1 - In Exercises 21-24, find the mean and median for...Ch. 3.1 - In Exercises 21-24, find the mean and median for...Ch. 3.1 - In Exercises 21-24, find the mean and median for...Ch. 3.1 - Large Data Sets from Appendix B. In Exercises...Ch. 3.1 - Large Data Sets from Appendix B. In Exercises...Ch. 3.1 - Large Data Sets from Appendix B. In Exercises...Ch. 3.1 - Large Data Sets from Appendix B. In Exercises...Ch. 3.1 - In Exercises 29-32, find the mean of the data...Ch. 3.1 - In Exercises 29-32, find the mean of the data...Ch. 3.1 - In Exercises 29-32, find the mean of the data...Ch. 3.1 - In Exercises 29-32, find the mean of the data...Ch. 3.1 - Weighted Mean A student of the author earned...Ch. 3.1 - Weighted Mean A student of the author earned...Ch. 3.1 - Degrees of Freedom Five pulse rates randomly...Ch. 3.1 - Censored Data Data Set 15 Presidents in Appendix B...Ch. 3.1 - Trimmed Mean Because the mean is very sensitive to...Ch. 3.1 - Harmonic Mean The harmonic mean is often used as a...Ch. 3.1 - Geometric Mean The geometric mean is often used in...Ch. 3.1 - Quadratic Mean The quadratic mean (or root mean...Ch. 3.1 - Median When data are summarized in a frequency...Ch. 3.2 - Range Rule of Thumb for Estimating s The 20 brain...Ch. 3.2 - Range Rule of Thumb for Interpreting s The 20...Ch. 3.2 - Variance The 20 subjects used in Data Set 8 IQ and...Ch. 3.2 - Symbols Identify the symbols used for each of the...Ch. 3.2 - In Exercises 5-20, find the range, variance, and...Ch. 3.2 - In Exercises 5-20, find the range, variance, and...Ch. 3.2 - In Exercises 5-20, find the range, variance, and...Ch. 3.2 - In Exercises 5-20, find the range, variance, and...Ch. 3.2 - In Exercises 5-20, find the range, variance, and...Ch. 3.2 - In Exercises 5-20, find the range, variance, and...Ch. 3.2 - In Exercises 5-20, find the range, variance, and...Ch. 3.2 - In Exercises 5-20, find the range, variance, and...Ch. 3.2 - In Exercises 5-20, find the range, variance, and...Ch. 3.2 - In Exercises 5-20, find the range, variance, and...Ch. 3.2 - In Exercises 5-20, find the range, variance, and...Ch. 3.2 - In Exercises 5-20, find the range, variance, and...Ch. 3.2 - In Exercises 5-20, find the range, variance, and...Ch. 3.2 - In Exercises 5-20, find the range, variance, and...Ch. 3.2 - In Exercises 5-20, find the range, variance, and...Ch. 3.2 - In Exercises 5-20, find the range, variance, and...Ch. 3.2 - In Exercises 21-24, find the coefficient of...Ch. 3.2 - In Exercises 21-24, find the coefficient of...Ch. 3.2 - In Exercises 21-24, find the coefficient of...Ch. 3.2 - In Exercises 21-24, find the coefficient of...Ch. 3.2 - Large Data Sets from Appendix B. In Exercises...Ch. 3.2 - Prob. 26BSCCh. 3.2 - Large Data Sets from Appendix B. In Exercises...Ch. 3.2 - Large Data Sets from Appendix B. In Exercises...Ch. 3.2 - Estimating Standard Deviation with the Range Rule...Ch. 3.2 - Prob. 30BSCCh. 3.2 - Estimating Standard Deviation with the Range Rule...Ch. 3.2 - Estimating Standard Deviation with the Range Rule...Ch. 3.2 - Identifying Significant Values with the Range Rule...Ch. 3.2 - Prob. 34BSCCh. 3.2 - Foot Lengths Based on Data Set 2 Foot and Height...Ch. 3.2 - Identifying Significant Values with the Range Rule...Ch. 3.2 - Finding Standard Deviation from a Frequency...Ch. 3.2 - Finding Standard Deviation from a Frequency...Ch. 3.2 - Finding Standard Deviation from a Frequency...Ch. 3.2 - Finding Standard Deviation from a Frequency...Ch. 3.2 - The Empirical Rule Based on Data Set 1 Body Data...Ch. 3.2 - The Empirical Rule Based on Data Set 3 Body...Ch. 3.2 - Chebyshevs Theorem Based on Data Set 1 Body Data...Ch. 3.2 - Chebyshevs Theorem Based on Data Set 3 Body...Ch. 3.2 - Why Divide by n 1? Let a population consist of...Ch. 3.2 - Mean Absolute Deviation Use the same population of...Ch. 3.3 - z Scores LeBron James, one of the most successful...Ch. 3.3 - Heights The boxplot shown below results from the...Ch. 3.3 - Boxplot Comparison Refer to the boxplots shown...Ch. 3.3 - z Scores If your score on your next statistics...Ch. 3.3 - z Scores. In Exercises 5-8, express all z scores...Ch. 3.3 - z Scores. In Exercises 5-8, express all z scores...Ch. 3.3 - z Scores. In Exercises 5-8, express all z scores...Ch. 3.3 - z Scores. In Exercises 5-8, express all z scores...Ch. 3.3 - Significant Values. In Exercises 9-12, consider a...Ch. 3.3 - Significant Values. In Exercises 9-12, consider a...Ch. 3.3 - Significant Values. In Exercises 9-12, consider a...Ch. 3.3 - Significant Values. In Exercises 9-12, consider a...Ch. 3.3 - Comparing Values. In Exercises 13-16, use z scores...Ch. 3.3 - Comparing Values. In Exercises 13-16, use z scores...Ch. 3.3 - Comparing Values. In Exercises 13-16, use z scores...Ch. 3.3 - Comparing Values. In Exercises 13-16, use z scores...Ch. 3.3 - Percentiles. In Exercises 17-20, use the following...Ch. 3.3 - Percentiles. In Exercises 17-20, use the following...Ch. 3.3 - Percentiles. In Exercises 17-20, use the following...Ch. 3.3 - Percentiles. In Exercises 17-20, use the following...Ch. 3.3 - Percentiles. In Exercises 17-20, use the following...Ch. 3.3 - Percentiles. In Exercises 17-20, use the following...Ch. 3.3 - Percentiles. In Exercises 17-20, use the following...Ch. 3.3 - Percentiles. In Exercises 17-20, use the following...Ch. 3.3 - Percentiles. In Exercises 17-20, use the following...Ch. 3.3 - Percentiles. In Exercises 17-20, use the following...Ch. 3.3 - Percentiles. In Exercises 17-20, use the following...Ch. 3.3 - Percentiles. In Exercises 17-20, use the following...Ch. 3.3 - Boxplots. In Exercises 29-32, use the given data...Ch. 3.3 - Boxplots. In Exercises 29-32, use the given data...Ch. 3.3 - Boxplots. In Exercises 29-32, use the given data...Ch. 3.3 - Boxplots. In Exercises 29-32, use the given data...Ch. 3.3 - Boxplots from Large Data Sets in Appendix B. In...Ch. 3.3 - Boxplots from Large Data Sets in Appendix B. In...Ch. 3.3 - Prob. 35BSCCh. 3.3 - Boxplots from Large Data Sets in Appendix B. In...Ch. 3.3 - Outliers and Modified Boxplots Repeat Exercise 33...Ch. 3 - Sleep Mean As part of the National Health and...Ch. 3 - Sleep Median What is the median of the sample...Ch. 3 - Sleep Mode What is the mode of the sample values...Ch. 3 - Sleep Variance The standard deviation of the...Ch. 3 - Prob. 5CQQCh. 3 - Sleep z Score A larger sample of 50 sleep times...Ch. 3 - Sleep Q3 For a sample of 80 sleep times,...Ch. 3 - Sleep 5-Number Summary For a sample of 100 sleep...Ch. 3 - Estimating s A large sample of sleep times...Ch. 3 - Sleep Notation Consider a sample of sleep times...Ch. 3 - Old Faithful Geyser Listed below are prediction...Ch. 3 - z Score Using the sample data from Exercise 1,...Ch. 3 - Boxplot Using the same prediction errors listed in...Ch. 3 - ER Codes In an analysis of activities that...Ch. 3 - Comparing Birth Weights The birth weights of a...Ch. 3 - Effects of an Outlier Listed below are platelet...Ch. 3 - Interpreting a Boxplot Shown below is a boxplot of...Ch. 3 - Estimating Standard Deviation Listed below is a...Ch. 3 - Prob. 1CRECh. 3 - Prob. 2CRECh. 3 - Stemplot Use the amounts of arsenic from Exercise...Ch. 3 - Prob. 4CRECh. 3 - Histogram The accompanying histogram depicts...Ch. 3 - Normal Distribution Examine the distribution shown...Ch. 3 - Words Spoken by Men and Women Refer to Data Set 24...Ch. 3 - Second-Hand Smoke Data Set 12 Passive and Active...
Knowledge Booster


Learn more about
Need a deep-dive on the concept behind this application? Look no further. Learn more about this topic, statistics and related others by exploring similar questions and additional content below.Similar questions
- For each of the time series, construct a line chart of the data and identify the characteristics of the time series (that is, random, stationary, trend, seasonal, or cyclical). Year Month Units1 Nov 42,1611 Dec 44,1862 Jan 42,2272 Feb 45,4222 Mar 54,0752 Apr 50,9262 May 53,5722 Jun 54,9202 Jul 54,4492 Aug 56,0792 Sep 52,1772 Oct 50,0872 Nov 48,5132 Dec 49,2783 Jan 48,1343 Feb 54,8873 Mar 61,0643 Apr 53,3503 May 59,4673 Jun 59,3703 Jul 55,0883 Aug 59,3493 Sep 54,4723 Oct 53,164arrow_forwardHigh Cholesterol: A group of eight individuals with high cholesterol levels were given a new drug that was designed to lower cholesterol levels. Cholesterol levels, in milligrams per deciliter, were measured before and after treatment for each individual, with the following results: Individual Before 1 2 3 4 5 6 7 8 237 282 278 297 243 228 298 269 After 200 208 178 212 174 201 189 185 Part: 0/2 Part 1 of 2 (a) Construct a 99.9% confidence interval for the mean reduction in cholesterol level. Let a represent the cholesterol level before treatment minus the cholesterol level after. Use tables to find the critical value and round the answers to at least one decimal place.arrow_forwardI worked out the answers for most of this, and provided the answers in the tables that follow. But for the total cost table, I need help working out the values for 10%, 11%, and 12%. A pharmaceutical company produces the drug NasaMist from four chemicals. Today, the company must produce 1000 pounds of the drug. The three active ingredients in NasaMist are A, B, and C. By weight, at least 8% of NasaMist must consist of A, at least 4% of B, and at least 2% of C. The cost per pound of each chemical and the amount of each active ingredient in one pound of each chemical are given in the data at the bottom. It is necessary that at least 100 pounds of chemical 2 and at least 450 pounds of chemical 3 be used. a. Determine the cheapest way of producing today’s batch of NasaMist. If needed, round your answers to one decimal digit. Production plan Weight (lbs) Chemical 1 257.1 Chemical 2 100 Chemical 3 450 Chemical 4 192.9 b. Use SolverTable to see how much the percentage of…arrow_forward
- At the beginning of year 1, you have $10,000. Investments A and B are available; their cash flows per dollars invested are shown in the table below. Assume that any money not invested in A or B earns interest at an annual rate of 2%. a. What is the maximized amount of cash on hand at the beginning of year 4.$ ___________ A B Time 0 -$1.00 $0.00 Time 1 $0.20 -$1.00 Time 2 $1.50 $0.00 Time 3 $0.00 $1.90arrow_forwardFor each of the time series, construct a line chart of the data and identify the characteristics of the time series (that is, random, stationary, trend, seasonal, or cyclical). Year Month Rate (%)2009 Mar 8.72009 Apr 9.02009 May 9.42009 Jun 9.52009 Jul 9.52009 Aug 9.62009 Sep 9.82009 Oct 10.02009 Nov 9.92009 Dec 9.92010 Jan 9.82010 Feb 9.82010 Mar 9.92010 Apr 9.92010 May 9.62010 Jun 9.42010 Jul 9.52010 Aug 9.52010 Sep 9.52010 Oct 9.52010 Nov 9.82010 Dec 9.32011 Jan 9.12011 Feb 9.02011 Mar 8.92011 Apr 9.02011 May 9.02011 Jun 9.12011 Jul 9.02011 Aug 9.02011 Sep 9.02011 Oct 8.92011 Nov 8.62011 Dec 8.52012 Jan 8.32012 Feb 8.32012 Mar 8.22012 Apr 8.12012 May 8.22012 Jun 8.22012 Jul 8.22012 Aug 8.12012 Sep 7.82012 Oct…arrow_forwardFor each of the time series, construct a line chart of the data and identify the characteristics of the time series (that is, random, stationary, trend, seasonal, or cyclical). Date IBM9/7/2010 $125.959/8/2010 $126.089/9/2010 $126.369/10/2010 $127.999/13/2010 $129.619/14/2010 $128.859/15/2010 $129.439/16/2010 $129.679/17/2010 $130.199/20/2010 $131.79 a. Construct a line chart of the closing stock prices data. Choose the correct chart below.arrow_forward
- For each of the time series, construct a line chart of the data and identify the characteristics of the time series (that is, random, stationary, trend, seasonal, or cyclical) Date IBM9/7/2010 $125.959/8/2010 $126.089/9/2010 $126.369/10/2010 $127.999/13/2010 $129.619/14/2010 $128.859/15/2010 $129.439/16/2010 $129.679/17/2010 $130.199/20/2010 $131.79arrow_forward1. A consumer group claims that the mean annual consumption of cheddar cheese by a person in the United States is at most 10.3 pounds. A random sample of 100 people in the United States has a mean annual cheddar cheese consumption of 9.9 pounds. Assume the population standard deviation is 2.1 pounds. At a = 0.05, can you reject the claim? (Adapted from U.S. Department of Agriculture) State the hypotheses: Calculate the test statistic: Calculate the P-value: Conclusion (reject or fail to reject Ho): 2. The CEO of a manufacturing facility claims that the mean workday of the company's assembly line employees is less than 8.5 hours. A random sample of 25 of the company's assembly line employees has a mean workday of 8.2 hours. Assume the population standard deviation is 0.5 hour and the population is normally distributed. At a = 0.01, test the CEO's claim. State the hypotheses: Calculate the test statistic: Calculate the P-value: Conclusion (reject or fail to reject Ho): Statisticsarrow_forward21. find the mean. and variance of the following: Ⓒ x(t) = Ut +V, and V indepriv. s.t U.VN NL0, 63). X(t) = t² + Ut +V, U and V incepires have N (0,8) Ut ①xt = e UNN (0162) ~ X+ = UCOSTE, UNNL0, 62) SU, Oct ⑤Xt= 7 where U. Vindp.rus +> ½ have NL, 62). ⑥Xn = ΣY, 41, 42, 43, ... Yn vandom sample K=1 Text with mean zen and variance 6arrow_forward
- A psychology researcher conducted a Chi-Square Test of Independence to examine whether there is a relationship between college students’ year in school (Freshman, Sophomore, Junior, Senior) and their preferred coping strategy for academic stress (Problem-Focused, Emotion-Focused, Avoidance). The test yielded the following result: image.png Interpret the results of this analysis. In your response, clearly explain: Whether the result is statistically significant and why. What this means about the relationship between year in school and coping strategy. What the researcher should conclude based on these findings.arrow_forwardA school counselor is conducting a research study to examine whether there is a relationship between the number of times teenagers report vaping per week and their academic performance, measured by GPA. The counselor collects data from a sample of high school students. Write the null and alternative hypotheses for this study. Clearly state your hypotheses in terms of the correlation between vaping frequency and academic performance. EditViewInsertFormatToolsTable 12pt Paragrapharrow_forwardA smallish urn contains 25 small plastic bunnies – 7 of which are pink and 18 of which are white. 10 bunnies are drawn from the urn at random with replacement, and X is the number of pink bunnies that are drawn. (a) P(X = 5) ≈ (b) P(X<6) ≈ The Whoville small urn contains 100 marbles – 60 blue and 40 orange. The Grinch sneaks in one night and grabs a simple random sample (without replacement) of 15 marbles. (a) The probability that the Grinch gets exactly 6 blue marbles is [ Select ] ["≈ 0.054", "≈ 0.043", "≈ 0.061"] . (b) The probability that the Grinch gets at least 7 blue marbles is [ Select ] ["≈ 0.922", "≈ 0.905", "≈ 0.893"] . (c) The probability that the Grinch gets between 8 and 12 blue marbles (inclusive) is [ Select ] ["≈ 0.801", "≈ 0.760", "≈ 0.786"] . The Whoville small urn contains 100 marbles – 60 blue and 40 orange. The Grinch sneaks in one night and grabs a simple random sample (without replacement) of 15 marbles. (a)…arrow_forward
arrow_back_ios
SEE MORE QUESTIONS
arrow_forward_ios
Recommended textbooks for you
 College Algebra (MindTap Course List)AlgebraISBN:9781305652231Author:R. David Gustafson, Jeff HughesPublisher:Cengage Learning
 Glencoe Algebra 1, Student Edition, 9780079039897...AlgebraISBN:9780079039897Author:CarterPublisher:McGraw Hill
 Holt Mcdougal Larson Pre-algebra: Student Edition...AlgebraISBN:9780547587776Author:HOLT MCDOUGALPublisher:HOLT MCDOUGAL
 Big Ideas Math A Bridge To Success Algebra 1: Stu...AlgebraISBN:9781680331141Author:HOUGHTON MIFFLIN HARCOURTPublisher:Houghton Mifflin Harcourt
College Algebra (MindTap Course List)
Algebra
ISBN:9781305652231
Author:R. David Gustafson, Jeff Hughes
Publisher:Cengage Learning
Glencoe Algebra 1, Student Edition, 9780079039897...
Algebra
ISBN:9780079039897
Author:Carter
Publisher:McGraw Hill
Holt Mcdougal Larson Pre-algebra: Student Edition...
Algebra
ISBN:9780547587776
Author:HOLT MCDOUGAL
Publisher:HOLT MCDOUGAL
Big Ideas Math A Bridge To Success Algebra 1: Stu...
Algebra
ISBN:9781680331141
Author:HOUGHTON MIFFLIN HARCOURT
Publisher:Houghton Mifflin Harcourt
Hypothesis Testing using Confidence Interval Approach; Author: BUM2413 Applied Statistics UMP;https://www.youtube.com/watch?v=Hq1l3e9pLyY;License: Standard YouTube License, CC-BY
Hypothesis Testing - Difference of Two Means - Student's -Distribution & Normal Distribution; Author: The Organic Chemistry Tutor;https://www.youtube.com/watch?v=UcZwyzwWU7o;License: Standard Youtube License