Regional Population Density The figure shows the population density (people per square mile) for the 50 states in the United States, based on an estimate from the U.S. Census Bureau. The regions are the Midwest (MW), Northeast (NE), South (S), and West (W). In the West, the potential outlier is California, and in the South, the potential outlier is Maryland. Why is it best to compare medians and interquartile ranges for these data rather than comparing means and standard deviations? List the approximate median number of people per square mile for each location; for example, the median for the MW is between 50 and 100. Also arrange the regions from lowest interquartile range (on the left) to highest.
Regional Population Density The figure shows the population density (people per square mile) for the 50 states in the United States, based on an estimate from the U.S. Census Bureau. The regions are the Midwest (MW), Northeast (NE), South (S), and West (W). In the West, the potential outlier is California, and in the South, the potential outlier is Maryland. Why is it best to compare medians and interquartile ranges for these data rather than comparing means and standard deviations? List the approximate median number of people per square mile for each location; for example, the median for the MW is between 50 and 100. Also arrange the regions from lowest interquartile range (on the left) to highest.
Solution Summary: The author explains why it is best to compare medians and interquartile ranges for the data rather than comparing means and standard deviations.
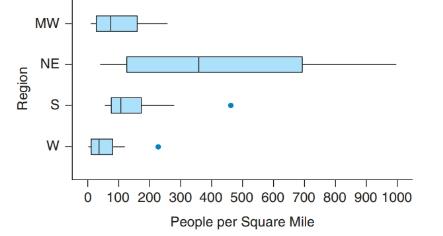
Regional Population Density The figure shows the population density (people per square mile) for the 50 states in the United States, based on an estimate from the U.S. Census Bureau. The regions are the Midwest (MW), Northeast (NE), South (S), and West (W). In the West, the potential outlier is California, and in the South, the potential outlier is Maryland.
Why is it best to compare medians and interquartile ranges for these data rather than comparing means and standard deviations? List the approximate median number of people per square mile for each location; for example, the median for the MW is between 50 and 100. Also arrange the regions from lowest interquartile range (on the left) to highest.
Find the critical value for a left-tailed test using the F distribution with a 0.025, degrees of freedom in the numerator=12, and degrees of freedom in the
denominator = 50. A portion of the table of critical values of the F-distribution is provided.
Click the icon to view the partial table of critical values of the F-distribution.
What is the critical value?
(Round to two decimal places as needed.)
A retail store manager claims that the average daily sales of the store are $1,500.
You aim to test whether the actual average daily sales differ significantly from this claimed value.
You can provide your answer by inserting a text box and the answer must include:
Null hypothesis,
Alternative hypothesis,
Show answer (output table/summary table), and
Conclusion based on the P value.
Showing the calculation is a must. If calculation is missing,so please provide a step by step on the answers
Numerical answers in the yellow cells
Need a deep-dive on the concept behind this application? Look no further. Learn more about this topic, statistics and related others by exploring similar questions and additional content below.


 Big Ideas Math A Bridge To Success Algebra 1: Stu...AlgebraISBN:9781680331141Author:HOUGHTON MIFFLIN HARCOURTPublisher:Houghton Mifflin Harcourt
 Glencoe Algebra 1, Student Edition, 9780079039897...AlgebraISBN:9780079039897Author:CarterPublisher:McGraw Hill
 Holt Mcdougal Larson Pre-algebra: Student Edition...AlgebraISBN:9780547587776Author:HOLT MCDOUGALPublisher:HOLT MCDOUGAL