
Subpart (a):
Demand and supply.
Subpart (a):
Answer to Problem 4P
Explanation of Solution
When the supply decreases with constant demand curve, it will lead to a decrease in the
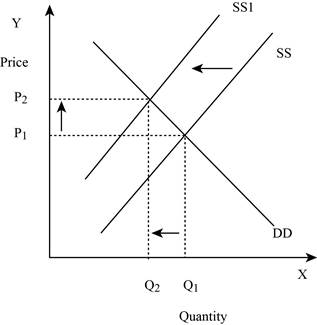
Figure -1
In Figure -1, the horizontal axis measures the quantity supplied and the vertical axis measures the price of the balls. ‘DD’ represents the demand and the demand curve shifts from DD to DD1; ‘SS’ represents the supply curve and the supply curve shifts from SS to SS1. Decrease in supply will lead to a decrease in the equilibrium quantity from ‘Q1 to Q2’ and an increase in the equilibrium price from ‘P1 to P2’.
Concept introduction:
Demand: Demand refers to the total value of the goods and services that are demanded at a particular price in the given period of time.
Supply: Supply refers to the total value of the goods and services that are available for purchase at a particular price in the given period of time.
Subpart (b):
Demand and supply.
Subpart (b):
Answer to Problem 4P
Price shifts down and quantity shifts down – b.
Explanation of Solution
When the demand decreases with constant supply curve, it will lead to a decrease in the equilibrium quantity and equilibrium price. This is shown below in Figure -2:
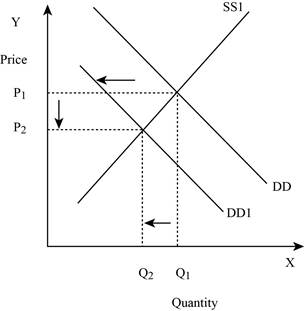
Figure -2
In Figure -2, the horizontal axis measures the quantity supplied and the vertical axis measures the price of the balls. ‘DD’ represents the demand and the demand curve shifts to the left from DD to DD1; ‘SS’ represents the supply curve. Decrease in supply will lead to a decrease in the equilibrium quantity from ‘Q1 to Q2’ and the equilibrium price from ‘P1 to P2’.
Concept introduction:
Demand: Demand refers to the total value of the goods and services that are demanded at a particular price in the given period of time.
Supply: Supply refers to the total value of the goods and services that are available for purchase at a particular price in the given period of time.
Subpart (c):
Demand and supply.
Subpart (c):
Answer to Problem 4P
Price shifts down and quantity shifts up – c.
Explanation of Solution
When the demand is constant with an increase in the supply curve, it will lead to a decrease in the equilibrium price and an increase in the equilibrium quantity. This is shown below in Figure -3:
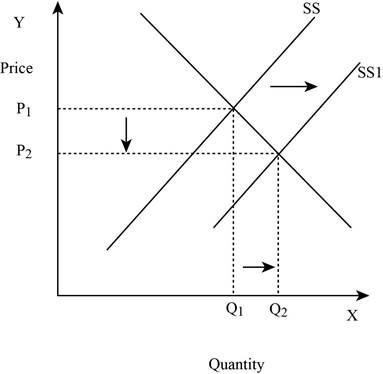
Figure -3
In Figure -3, the horizontal axis measures the quantity supplied and the vertical axis measures the price of the balls. ‘DD’ represents the demand and ‘SS’ represents the supply curve and the supply curve shifts to the right from SS to SS1. Increase in supply will lead to a decrease in the equilibrium price from ‘P1 to P2’ and an increase in the equilibrium quantity from ‘Q1 to Q2’.
Concept introduction:
Demand: Demand refers to the total value of the goods and services that are demanded at a particular price in the given period of time.
Supply: Supply refers to the total value of the goods and services that are available for purchase at a particular price in the given period of time.
Subpart (d):
Demand and supply.
Subpart (d):
Answer to Problem 4P
Price will indeterminate and quantity shifts up – d.
Explanation of Solution
When both the demand and supply increases, it will lead to an increase in the equilibrium quantity and the change in price is indeterminate. This is because an increase in the supply puts a downward pressure on the equilibrium price. This is shown below in Figure – 4:
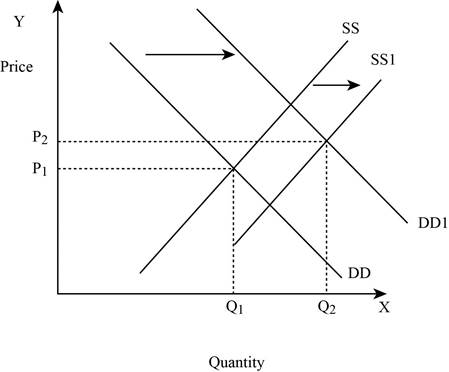
Figure -4
In Figure -4, the horizontal axis measures the quantity supplied and the vertical axis measures the price of the balls. ‘DD’ represents the demand curve and ‘SS’ represents the supply curve. Due to the increase in supply and demand, the supply curve shifts to the right from SS to SS1 and the demand curve shifts from DD to DD1. An increase in the supply leads to an increase in the equilibrium price from ‘P1 to P2’ and the equilibrium quantity from ‘Q1 to Q2’.
Concept introduction:
Demand: Demand refers to the total value of the goods and services that are demanded at a particular price in the given period of time.
Supply: Supply refers to the total value of the goods and services that are available for purchase at a particular price in the given period of time.
Subpart (e):
Demand and supply.
Subpart (e):
Answer to Problem 4P
Price shifts up and quantity shifts up – e.
Explanation of Solution
If the demand increases with constant supply, it leads to an increase in the equilibrium quantity and equilibrium price. This is shown below in Figure – 5:
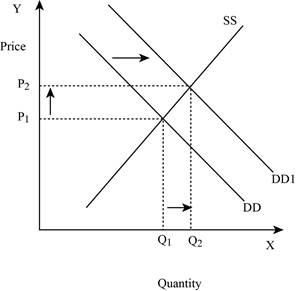
Figure -5
In Figure -5, the horizontal axis measures the quantity supplied and the vertical axis measures the price of the balls. ‘DD’ represents the demand curve and ‘SS’ represents the supply curve. Due to an increase in demand, the demand curve will shift the curve to the right from DD to DD1. An increase in demand will increase the equilibrium price from ‘P1 to P2’ and increases the equilibrium quantity from ‘Q1 to Q2’.
Concept introduction:
Demand: Demand refers to the total value of the goods and services that are demanded at a particular price in the given period of time.
Supply: Supply refers to the total value of the goods and services that are available for purchase at a particular price in the given period of time.
Subpart (f):
Demand and supply.
Subpart (f):
Answer to Problem 4P
Price shifts down and quantity indeterminate – f.
Explanation of Solution
If the supply increases with a decrease in demand, it leads to a decrease in the equilibrium price because both the curves put a pressure on the equilibrium price. Thus, an increase in supply increases the equilibrium quantity and a decrease in demand lead to a decrease in the equilibrium quantity. This is shown below in Figure – 6:
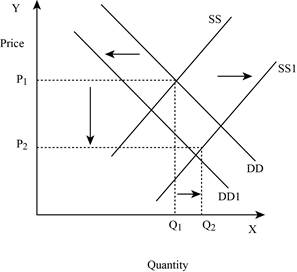
Figure -6
In Figure -6, the horizontal axis measures the quantity supplied and the vertical axis measures the price of the balls. ‘DD’ represents the demand curve and ‘SS’ represents the supply curve. Due to a decrease in demand and an increase in supply, demand curve will shift the curve to the left from DD to DD1. An increase in supply will lead to an increase in the equilibrium quantity from ‘P1 to P2’ and increases the equilibrium quantity from ‘Q1 to Q2’.
Concept introduction:
Demand: Demand refers to the total value of the goods and services that are demanded at a particular price in the given period of time.
Supply: Supply refers to the total value of the goods and services that are available for purchase at a particular price in the given period of time.
Subpart (g):
Demand and supply.
Subpart (g):
Answer to Problem 4P
Price shifts up and quantity indeterminate – g.
Explanation of Solution
If the supply decreases with an increase in demand, it will lead to an increase in the equilibrium price because both the curve put a pressure on the equilibrium price. An increase in demand will lead to an increase in the equilibrium quantity. This is shown below in Figure – 7:
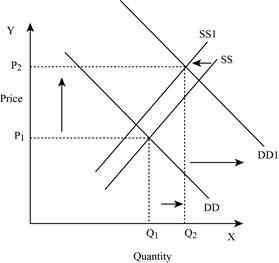
Figure -7
In Figure -7, the horizontal axis measures the quantity supplied and the vertical axis measures the price of the balls. ‘DD’ represents the demand and ‘SS’ represents the supply curve. Due to a decrease in supply and an increase in demand, the supply curve will shift the curve to the left from SS to SS1 and the demand curve shifts the curve to the right, which leads to an increase in the equilibrium price from ‘P1 to P2’ and the equilibrium quantity from ‘Q1 to Q2’.
Concept introduction:
Demand: Demand refers to the total value of the goods and services that are demanded at a particular price in the given period of time.
Supply: Supply refers to the total value of the goods and services that are available for purchase at a particular price in the given period of time.
Subpart (h):
Demand and supply.
Subpart (h):
Answer to Problem 4P
Price indeterminate and quantity shifts down – h.
Explanation of Solution
If both the supply and demand decreases, then it lead to a decrease in the equilibrium quantity and the change in equilibrium price is indeterminate. This is because a decrease in supply puts an upward pressure on the equilibrium price. This is shown below in Figure – 8:
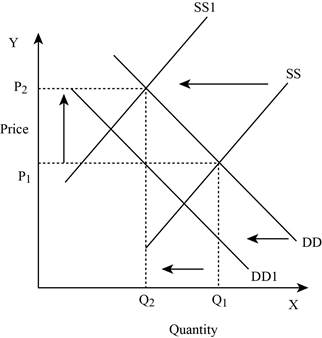
Figure -8
In Figure -8, the horizontal axis measures the quantity supplied and the vertical axis measures the price of the balls. ‘DD’ represents the demand and ‘SS’ represents the supply curve. Due to a decrease in supply and a decrease in demand, the supply curve will shift the curve to the left from SS to SS1 and the demand curve shifts the curve to the left, which lead to an increase in the equilibrium price from ‘P1 to P2’ and a decrease in the equilibrium quantity from ‘Q1 to Q2’.
Concept introduction:
Demand: Demand refers to the total value of the goods and services that are demanded at a particular price in the given period of time.
Supply: Supply refers to the total value of the goods and services that are available for purchase at a particular price in the given period of time.
Want to see more full solutions like this?
Chapter 3 Solutions
MICROECONOMICS(LL)COMPANION

- Answer these questions using replication or the risk neutral probability. Both methods will produce the same answer. Show your work to receive credit. 6. What is the premium of a call with a higher strike. Show your work to receive credit; do not round intermediate calculations. S0 = $100, u=2, d=0.5, r=10%, strike=$150arrow_forwardAnswer these questions using replication or the risk neutral probability. Both methods will produce the same answer.arrow_forwardProblem 2: At a raffle, 2000 tickets are sold at $5 each for five prizes of $2000, $1000, $500, $250, and $100. You buy one ticket. What is the expected value of your gain? 1. Find the gain for each prize. 2. Write a probability distribution for the possible gains. 3. Find the expected value. 4. Interpret the results.arrow_forward
- This activity focuses on developing direct and supported opinions using various sources of information on the importance of the following topics: non-renewable and renewable energies, economic factors and obstacles that can affect the relationship between international trade and economic growth, devaluation of the currency in countries, and the imbalance of economic equity. In this context, it is essential that, when studying and developing these topics, students understand the concepts of the value of currencies and that leads to devaluation, non-renewable and renewable energy resources, economic development and obstacles, distribution of wealth, economic growth and external and internal constraints, and about international trade as a growth factor. Thus, the objectives that are intended to be achieved are the following: Acquire knowledge about the concepts mentioned above. Determine relationships between economic growth and international trade. Understand what some limitations that…arrow_forwardConsider a firm facing conventional production technology. The short run Production Function has a small range of increasing marginal product (increasing marginal returns) and then is subject to the Law of Diminishing Marginal Product (diminishing marginal returns). A. Putting quantity on the horizontal axis and dollars on the vertical axis, depict three important curves: Fixed Cost (FC), Variable Cost (VC), and Total Cost (TC). (Note that we are not asking you to depict average cost functions!) B. Please clearly indicate on this graph the range of quantities where the firm is experiencing (1) increasing marginal product and (2) diminishing marginal product. C. In a few sentences, please justify why you've made this specific classification of increasing/diminishing marginal product in part (b).arrow_forwardplease answer the following questions: What is money, and why does anyone want it? Explain the concept of the opportunity cost of holding money . Explain why an increase in U.S. interest rates relative to UK interest rates would affect the U.S.-UK exchange rate. Suppose that a person’s wealth is $50,000 and that her yearlyincome is $60,000. Also suppose that her money demand functionis given by Md = $Y10.35 - i2Derive the demand for bonds. Suppose the interest rate increases by 10 percentage points. What is the effect on her demand for bonds?b. What are the effects of an increase in income on her demand for money and her demand for bonds? Explain in wordsarrow_forward
- Driving Quiz X My Course G city place w x D2L Login - Univ X D2L Login - Univ x D2L Login - U acmillanlearning.com/ihub/assessment/f188d950-dd73-11e0-9572-0800200c9a66/4db68a5e-69bb-4767-8d6c-a12d +1687 pts /1800 © Macmillan Learning Question 6 of 18 > The graph shows the average total cost (ATC) curve, the marginal cost (MC) curve, the average variable cost (AVC) curve, and the marginal revenue (MR) curve (which is also the market price) for a perfectly competitive firm that produces terrible towels. Answer the three questions, assuming that the firm is profit-maximizing and does not shut down in the short run. What is the firm's total revenue? S What is the firm's total cost? $ What is the firm's profit? (Enter a negative number for a loss.) $ Price $320 $300 $200 $150 205 260 336 365 Quantity MC ATC AVC MR=Parrow_forward1. Suppose that the two nations face the following benefits of pollution, B, and costs of abatement, C: BN = 10, Bs = 7; CN = 5, Cs = 4. Further assume that if the nation chooses to abate pollution, it still receives the benefits of pollution but now must pay the cost of abatement as well. a. Identify the payoffs that accrue to each nation under the four different possible outcomes of the game and present these payoffs in the normal form of the game. b. Recall that the term dominant strategy defines the condition that a player in a game would prefer to play that strategy (in this case either pollute or abate) regardless of the strategy chosen by the other player in the game. Does either nation have a dominant strategy in this game? If so, what is it? c. Identify the Nash equilibria, or non-cooperative equilibria, of this game.arrow_forwardagrody calming Inted 001 and me 2. A homeowner is concerned about the various air pollutants (e.g., benzene and methane) released in her house when she cooks with natural gas. She is considering replacing her gas oven and stove with an electric stove comprising an induction cooktop and convection oven. The new appliance costs $900 to purchase and install. Capping the old gas line costs an additional $150 (a one-time fee). The old line must be inspected for leaks each year after capping, at a cost of $35 for each inspection. a. If the homeowner plans to remain in the house for four more years and the discount rate is 4%, what is the minimum present value of the benefits that the homeowner would need to experience for this purchase to be justified based on its private net sub present value? b. While trying to understand how she might express the value of reduced exposure to indoor air pollutants in dollar terms, the homeowner consulted the EPA website and found estimates provided by…arrow_forward
- After the ban is imposed, Joe’s firm switches to the more expensive biodegradable disposable cups. This increases the cost associated with each cup of coffee it produces. Which cost curve(s) will be impacted by the use of the more expensive biodegradable disposable cups? Why? Which cost curve(s) will not shift, and why not? Please use the table below to answer this question. For the second column (“Impacted? If so, how?”), please use one of the following three choices: No shift; Shifts up (i.e., increases: at nearly any given quantity, the cost goes up); or Shifts down (i.e., decreases: at nearly any given quantity, the cost goes down). $ Cost Curve Impacted? If so, how? Explanation of the Shift: Why or Why Not AFC No shift. Fix costs stay the same, regardless of quantity. Fixed cost is calculated as Fixed Cost/Quantity. Since fixed costs remain unchanged, AFC stays the same for each quantity. MC Shifts up. Since the biodegradable cups are more expensive, the…arrow_forwardStyrofoam is non-biodegradable and is not easily recyclable. Many cities and at least one state have enacted laws that ban the use of polystyrene containers. These locales understand that banning these containers will force many businesses to turn to other more expensive forms of packaging and cups, but argue the ban is environmentally important. Shane owns a firm with a conventional production function resulting in U-shaped ATC, AVC, and MC curves. Shane's business sells takeout food and drinks that are currently packaged in styrofoam containers and cups. Graph the short-run AFC0, AVC0, ATC0, and MC0 curves for Shane's firm before the ban on using styrofoam containers.arrow_forwardd-farrow_forward
 Brief Principles of Macroeconomics (MindTap Cours...EconomicsISBN:9781337091985Author:N. Gregory MankiwPublisher:Cengage Learning
 Principles of MicroeconomicsEconomicsISBN:9781305156050Author:N. Gregory MankiwPublisher:Cengage Learning
 Essentials of Economics (MindTap Course List)EconomicsISBN:9781337091992Author:N. Gregory MankiwPublisher:Cengage Learning
 Principles of Economics (MindTap Course List)EconomicsISBN:9781305585126Author:N. Gregory MankiwPublisher:Cengage Learning
 Principles of Microeconomics (MindTap Course List)EconomicsISBN:9781305971493Author:N. Gregory MankiwPublisher:Cengage Learning