Subpart (a):
Demand and supply.
Subpart (a):
Answer to Problem 4P
Explanation of Solution
When the supply decreases with constant demand curve, it will lead to a decrease in the
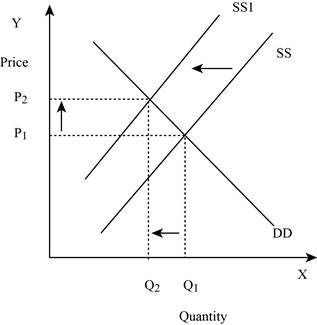
Figure -1
In Figure -1, the horizontal axis measures the quantity supplied and the vertical axis measures the price of the balls. ‘DD’ represents the demand and the demand curve shifts from DD to DD1; ‘SS’ represents the supply curve and the supply curve shifts from SS to SS1. Decrease in supply will lead to a decrease in the equilibrium quantity from ‘Q1 to Q2’ and an increase in the equilibrium price from ‘P1 to P2’.
Concept introduction:
Demand: Demand refers to the total value of the goods and services that are demanded at a particular price in the given period of time.
Supply: Supply refers to the total value of the goods and services that are available for purchase at a particular price in the given period of time.
Subpart (b):
Demand and supply.
Subpart (b):
Answer to Problem 4P
Price shifts down and quantity shifts down – b.
Explanation of Solution
When the demand decreases with constant supply curve, it will lead to a decrease in the equilibrium quantity and equilibrium price. This is shown below in Figure -2:
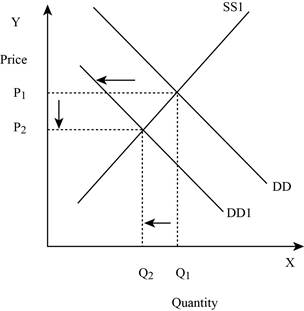
Figure -2
In Figure -2, the horizontal axis measures the quantity supplied and the vertical axis measures the price of the balls. ‘DD’ represents the demand and the demand curve shifts to the left from DD to DD1; ‘SS’ represents the supply curve. Decrease in supply will lead to a decrease in the equilibrium quantity from ‘Q1 to Q2’ and the equilibrium price from ‘P1 to P2’.
Concept introduction:
Demand: Demand refers to the total value of the goods and services that are demanded at a particular price in the given period of time.
Supply: Supply refers to the total value of the goods and services that are available for purchase at a particular price in the given period of time.
Subpart (c):
Demand and supply.
Subpart (c):
Answer to Problem 4P
Price shifts down and quantity shifts up – c.
Explanation of Solution
When the demand is constant with an increase in the supply curve, it will lead to a decrease in the equilibrium price and an increase in the equilibrium quantity. This is shown below in Figure -3:
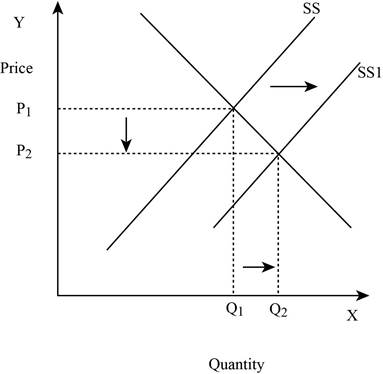
Figure -3
In Figure -3, the horizontal axis measures the quantity supplied and the vertical axis measures the price of the balls. ‘DD’ represents the demand and ‘SS’ represents the supply curve and the supply curve shifts to the right from SS to SS1. Increase in supply will lead to a decrease in the equilibrium price from ‘P1 to P2’ and an increase in the equilibrium quantity from ‘Q1 to Q2’.
Concept introduction:
Demand: Demand refers to the total value of the goods and services that are demanded at a particular price in the given period of time.
Supply: Supply refers to the total value of the goods and services that are available for purchase at a particular price in the given period of time.
Subpart (d):
Demand and supply.
Subpart (d):
Answer to Problem 4P
Price will indeterminate and quantity shifts up – d.
Explanation of Solution
When both the demand and supply increases, it will lead to an increase in the equilibrium quantity and the change in price is indeterminate. This is because an increase in the supply puts a downward pressure on the equilibrium price. This is shown below in Figure – 4:
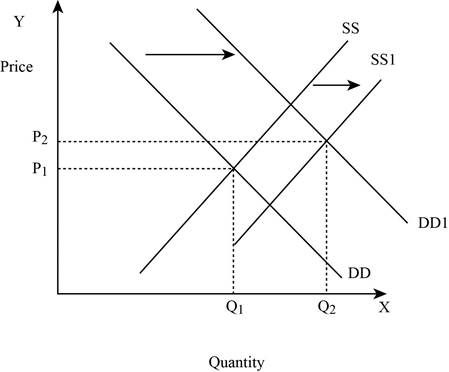
Figure -4
In Figure -4, the horizontal axis measures the quantity supplied and the vertical axis measures the price of the balls. ‘DD’ represents the demand curve and ‘SS’ represents the supply curve. Due to the increase in supply and demand, the supply curve shifts to the right from SS to SS1 and the demand curve shifts from DD to DD1. An increase in the supply leads to an increase in the equilibrium price from ‘P1 to P2’ and the equilibrium quantity from ‘Q1 to Q2’.
Concept introduction:
Demand: Demand refers to the total value of the goods and services that are demanded at a particular price in the given period of time.
Supply: Supply refers to the total value of the goods and services that are available for purchase at a particular price in the given period of time.
Subpart (e):
Demand and supply.
Subpart (e):
Answer to Problem 4P
Price shifts up and quantity shifts up – e.
Explanation of Solution
If the demand increases with constant supply, it leads to an increase in the equilibrium quantity and equilibrium price. This is shown below in Figure – 5:
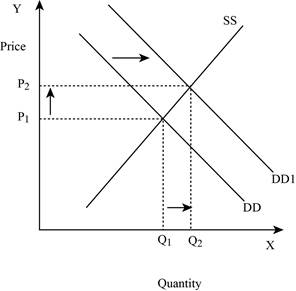
Figure -5
In Figure -5, the horizontal axis measures the quantity supplied and the vertical axis measures the price of the balls. ‘DD’ represents the demand curve and ‘SS’ represents the supply curve. Due to an increase in demand, the demand curve will shift the curve to the right from DD to DD1. An increase in demand will increase the equilibrium price from ‘P1 to P2’ and increases the equilibrium quantity from ‘Q1 to Q2’.
Concept introduction:
Demand: Demand refers to the total value of the goods and services that are demanded at a particular price in the given period of time.
Supply: Supply refers to the total value of the goods and services that are available for purchase at a particular price in the given period of time.
Subpart (f):
Demand and supply.
Subpart (f):
Answer to Problem 4P
Price shifts down and quantity indeterminate – f.
Explanation of Solution
If the supply increases with a decrease in demand, it leads to a decrease in the equilibrium price because both the curves put a pressure on the equilibrium price. Thus, an increase in supply increases the equilibrium quantity and a decrease in demand lead to a decrease in the equilibrium quantity. This is shown below in Figure – 6:
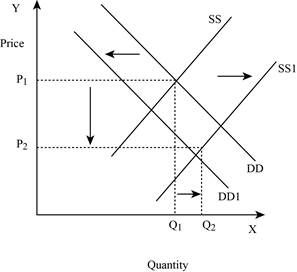
Figure -6
In Figure -6, the horizontal axis measures the quantity supplied and the vertical axis measures the price of the balls. ‘DD’ represents the demand curve and ‘SS’ represents the supply curve. Due to a decrease in demand and an increase in supply, demand curve will shift the curve to the left from DD to DD1. An increase in supply will lead to an increase in the equilibrium quantity from ‘P1 to P2’ and increases the equilibrium quantity from ‘Q1 to Q2’.
Concept introduction:
Demand: Demand refers to the total value of the goods and services that are demanded at a particular price in the given period of time.
Supply: Supply refers to the total value of the goods and services that are available for purchase at a particular price in the given period of time.
Subpart (g):
Demand and supply.
Subpart (g):
Answer to Problem 4P
Price shifts up and quantity indeterminate – g.
Explanation of Solution
If the supply decreases with an increase in demand, it will lead to an increase in the equilibrium price because both the curve put a pressure on the equilibrium price. An increase in demand will lead to an increase in the equilibrium quantity. This is shown below in Figure – 7:
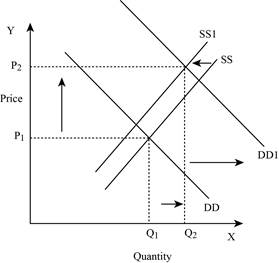
Figure -7
In Figure -7, the horizontal axis measures the quantity supplied and the vertical axis measures the price of the balls. ‘DD’ represents the demand and ‘SS’ represents the supply curve. Due to a decrease in supply and an increase in demand, the supply curve will shift the curve to the left from SS to SS1 and the demand curve shifts the curve to the right, which leads to an increase in the equilibrium price from ‘P1 to P2’ and the equilibrium quantity from ‘Q1 to Q2’.
Concept introduction:
Demand: Demand refers to the total value of the goods and services that are demanded at a particular price in the given period of time.
Supply: Supply refers to the total value of the goods and services that are available for purchase at a particular price in the given period of time.
Subpart (h):
Demand and supply.
Subpart (h):
Answer to Problem 4P
Price indeterminate and quantity shifts down – h.
Explanation of Solution
If both the supply and demand decreases, then it lead to a decrease in the equilibrium quantity and the change in equilibrium price is indeterminate. This is because a decrease in supply puts an upward pressure on the equilibrium price. This is shown below in Figure – 8:
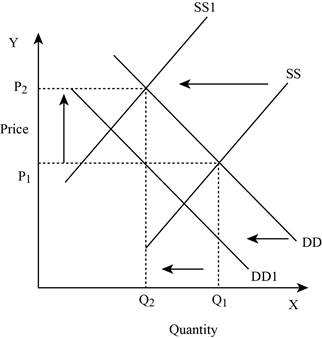
Figure -8
In Figure -8, the horizontal axis measures the quantity supplied and the vertical axis measures the price of the balls. ‘DD’ represents the demand and ‘SS’ represents the supply curve. Due to a decrease in supply and a decrease in demand, the supply curve will shift the curve to the left from SS to SS1 and the demand curve shifts the curve to the left, which lead to an increase in the equilibrium price from ‘P1 to P2’ and a decrease in the equilibrium quantity from ‘Q1 to Q2’.
Concept introduction:
Demand: Demand refers to the total value of the goods and services that are demanded at a particular price in the given period of time.
Supply: Supply refers to the total value of the goods and services that are available for purchase at a particular price in the given period of time.
Want to see more full solutions like this?
Chapter 3 Solutions
MACROECONOMICS (LL)

- Explain how much of emotional, mental and physical toll makes it so difficult to break the cycle of poverty.arrow_forwardCase Study: The Impact of Ebola on Tax Revenue in the DRC Background: The Democratic Republic of the Congo has experienced mulitiple outbreaks, with the 2018-2020 outbreak being one of the most severe. The outbreak had profound effects on public health, the economy and government operations. The DRC's economy already fragile due to policital instability and conflict, faced additional stain as the Ebola virus spread across several provinces. Economic disruption: The Ebola outbreak led to significant disruptions in the affected regions. Businesses were forced to close or reduce operations due to quarantine measures and the fear of contagion. this resulted in a sharp decline in economic activities, particularly in sectors such as agriculute, mining and trade. reduced consumer spending and interruptions in supply chains further exacerbated the economic downturn. Impact on Tax Revenue: the economic…arrow_forwardKey shortcomings of the Human Capital approach to measuring the monetary value of benefits of new treatments are that it Will generate lower benefits for male lives on average Will generate higher benefits for female lives on average Will tend to OVERVALUE improvements in quality of life Will tend to UNDERVALUE improved survival for people out of labour forcearrow_forward
- One of the key concepts in economics that underpins the necessity of making tough choices and confronting difficult tradeoffs through some form of collective decision-making is called Production Consumption Exchange Equity Scarcityarrow_forwardAllocative efficiency WITHIN the health care sector refers to What mix of nonmedical and medical goods and services should be produced in the macro-economy What mix of medical goods and services should be produced in the health economy What specific health care resources should be used to produce the chosen medical goods and services Who should receive the medical goods and services that are producedarrow_forwardProduction efficiency is most concerned with Choice of inputs in production process Quantity of outputs resulting from the production process The technological process of production All of the abovearrow_forward
- Choose all of the following that are assumed to be constant while constructing the production possibilities curve Technology Precise mix of inputs Institutional arrangements like judicial protection of business contracts Outputsarrow_forwardA point that lies OUTSIDE of the PPC can be achieved if A major technological innovation increases production efficiency A sudden influx of resources e.g., massive immigration of trained nurses Economic reform resulting in greater protection of intellectual property rights All of the above Only options 1 and 2arrow_forwardThe marginal benefit from each successive unit of medical care consumed declines BECAUSE each successive unit is more expensive to produce True Falsearrow_forward
 Principles of Economics 2eEconomicsISBN:9781947172364Author:Steven A. Greenlaw; David ShapiroPublisher:OpenStax
 Essentials of Economics (MindTap Course List)EconomicsISBN:9781337091992Author:N. Gregory MankiwPublisher:Cengage Learning
 Principles of Economics (MindTap Course List)EconomicsISBN:9781305585126Author:N. Gregory MankiwPublisher:Cengage Learning
 Principles of Microeconomics (MindTap Course List)EconomicsISBN:9781305971493Author:N. Gregory MankiwPublisher:Cengage Learning
 Principles of Economics, 7th Edition (MindTap Cou...EconomicsISBN:9781285165875Author:N. Gregory MankiwPublisher:Cengage Learning
 Brief Principles of Macroeconomics (MindTap Cours...EconomicsISBN:9781337091985Author:N. Gregory MankiwPublisher:Cengage Learning