
Concept explainers
a
To prove:
Graphical representation of utility function whether IC curve is convex or not.
a
Explanation of Solution
The utility function is linear. This means that the goods x and y are perfect substitutes. For simplicity, the value of utility is taken to be constant at 60. Then the equation for the indifference curve becomes:
To graph the indifference curve:
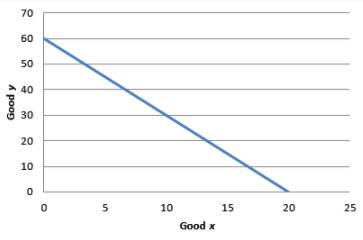
Graph 1
The MRS is constant at 3. Hence, the IC curve is not convex.
Introduction:
Rate of substitution is the ratio of two goods at which consumer gives away a quantity of good 1 in order to get good 2
b)
To prove:
Graphical representation of utility function whether IC curve is convex or not.
b)
Explanation of Solution
Let utility function be set equal to 10.
Then the equation will be:
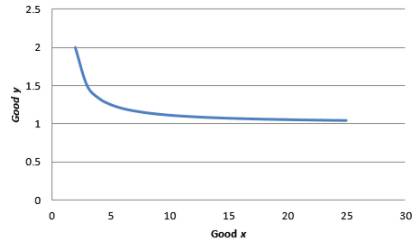
The IC for utility equal to 10 can be obtained by graphing the following equation:
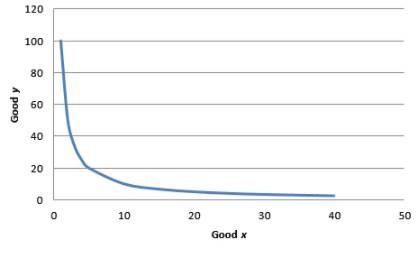
Graph 2
For equation,
As x is in the denominator, the MRS decreases when x increases. Hence indifference curve is convex.
Introduction:
Rate of substitution is the ratio of two goods at which consumer gives away a quantity of good 1 in order to get good 2
c)
To prove:
Graphical representation of utility function whether IC curve is convex or not.
c)
Explanation of Solution
To simplify the function, arbitrarily set the utility at 8. So, the utility function becomes
Graphical representation:
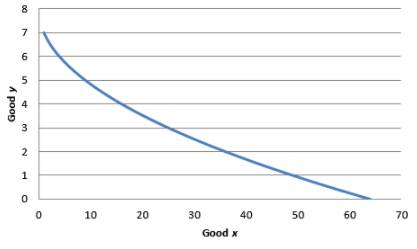
Graph 3
As x is in the denominator, the MRS decreases when x increases. Hence indifference curve is convex.
Introduction:
Rate of substitution is the ratio of two goods at which consumer gives away a quantity of good 1 in order to get good 2
d)
To prove:
Graphical representation of utility function whether IC curve is convex or not.
d)
Explanation of Solution
Utility is set equal to 4. Then the equation for equation is:
The indifference curve for utility equal to 4:
The graph is shown below:
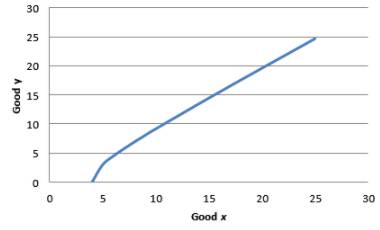
Graph 4
In the above equation, x is numerator. Though there is a negative sign in front of the fraction. This means that as x increases, the marginal rate of substitution increases.
Hence, the indifference curves are not convex.
Introduction:
Rate of substitution is the ratio of two goods at which consumer gives away a quantity of good 1 in order to get good 2
e)
To prove:
Graphical representation of utility function whether IC curve is convex or not.
e)
Explanation of Solution
To simplify the problem, we arbitrarily take utility equal to 1.
To graph the indifference curve,
Graph 5
MRS =
In the above equation, x is in numerator. Hence, as x increases the marginal rate of substitution decreases. Hence, the indifference curves are convex.
Introduction:
Rate of substitution is the ratio of two goods at which consumer gives away a quantity of good 1 in order to get good 2
Want to see more full solutions like this?


- Use a game tree to illustrate why an aircraft manufacturer may price below the current marginal cost in the short run if it has a steep learning curve. (Hint: Show that learning by doing lowers its cost in the second period.) Part 2 Assume for simplicity the game tree is illustrated in the figure to the right. Pricing below marginal cost reduces profits but gives the incumbent a cost advantage over potential rivals. What is the subgame perfect Nash equilibrium?arrow_forwardAnswerarrow_forwardM” method Given the following model, solve by the method of “M”. (see image)arrow_forward
- As indicated in the attached image, U.S. earnings for high- and low-skill workers as measured by educational attainment began diverging in the 1980s. The remaining questions in this problem set use the model for the labor market developed in class to walk through potential explanations for this trend. 1. Assume that there are just two types of workers, low- and high-skill. As a result, there are two labor markets: supply and demand for low-skill workers and supply and demand for high-skill workers. Using two carefully drawn labor-market figures, show that an increase in the demand for high skill workers can explain an increase in the relative wage of high-skill workers. 2. Using the same assumptions as in the previous question, use two carefully drawn labor-market figures to show that an increase in the supply of low-skill workers can explain an increase in the relative wage of high-skill workers.arrow_forwardPublished in 1980, the book Free to Choose discusses how economists Milton Friedman and Rose Friedman proposed a one-sided view of the benefits of a voucher system. However, there are other economists who disagree about the potential effects of a voucher system.arrow_forwardThe following diagram illustrates the demand and marginal revenue curves facing a monopoly in an industry with no economies or diseconomies of scale. In the short and long run, MC = ATC. a. Calculate the values of profit, consumer surplus, and deadweight loss, and illustrate these on the graph. b. Repeat the calculations in part a, but now assume the monopoly is able to practice perfect price discrimination.arrow_forward

 Economics (MindTap Course List)EconomicsISBN:9781337617383Author:Roger A. ArnoldPublisher:Cengage Learning
 Microeconomics: Principles & PolicyEconomicsISBN:9781337794992Author:William J. Baumol, Alan S. Blinder, John L. SolowPublisher:Cengage Learning
