
Concept explainers
a
To prove:
Graphical representation of utility function whether IC curve is convex or not.
a
Explanation of Solution
The utility function is linear. This means that the goods x and y are perfect substitutes. For simplicity, the value of utility is taken to be constant at 60. Then the equation for the indifference curve becomes:
To graph the indifference curve:
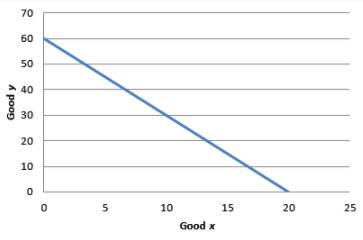
Graph 1
The MRS is constant at 3. Hence, the IC curve is not convex.
Introduction:
Rate of substitution is the ratio of two goods at which consumer gives away a quantity of good 1 in order to get good 2
b)
To prove:
Graphical representation of utility function whether IC curve is convex or not.
b)
Explanation of Solution
Let utility function be set equal to 10.
Then the equation will be:
The IC for utility equal to 10 can be obtained by graphing the following equation:
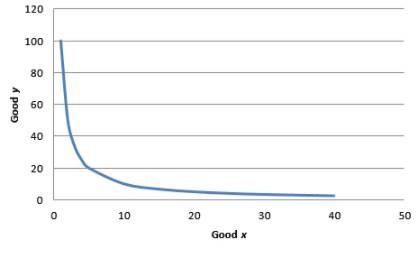
Graph 2
For equation,
As x is in the denominator, the MRS decreases when x increases. Hence indifference curve is convex.
Introduction:
Rate of substitution is the ratio of two goods at which consumer gives away a quantity of good 1 in order to get good 2
c)
To prove:
Graphical representation of utility function whether IC curve is convex or not.
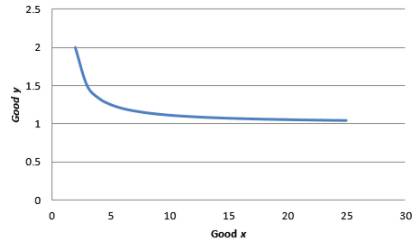
c)
Explanation of Solution
To simplify the function, arbitrarily set the utility at 8. So, the utility function becomes
Graphical representation:
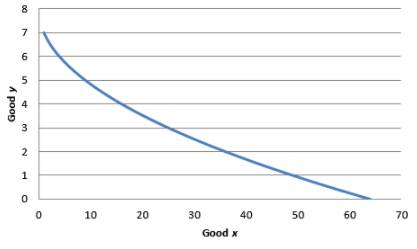
Graph 3
As x is in the denominator, the MRS decreases when x increases. Hence indifference curve is convex.
Introduction:
Rate of substitution is the ratio of two goods at which consumer gives away a quantity of good 1 in order to get good 2
d)
To prove:
Graphical representation of utility function whether IC curve is convex or not.
d)
Explanation of Solution
Utility is set equal to 4. Then the equation for equation is:
The indifference curve for utility equal to 4:
The graph is shown below:
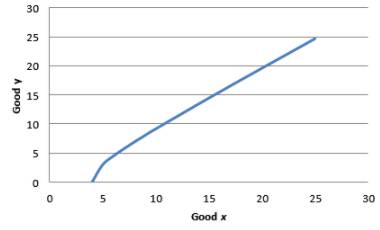
Graph 4
In the above equation, x is numerator. Though there is a negative sign in front of the fraction. This means that as x increases, the marginal rate of substitution increases.
Hence, the indifference curves are not convex.
Introduction:
Rate of substitution is the ratio of two goods at which consumer gives away a quantity of good 1 in order to get good 2
e)
To prove:
Graphical representation of utility function whether IC curve is convex or not.
e)
Explanation of Solution
To simplify the problem, we arbitrarily take utility equal to 1.
To graph the indifference curve,
Graph 5
MRS =
In the above equation, x is in numerator. Hence, as x increases the marginal rate of substitution decreases. Hence, the indifference curves are convex.
Introduction:
Rate of substitution is the ratio of two goods at which consumer gives away a quantity of good 1 in order to get good 2
Want to see more full solutions like this?
Chapter 3 Solutions
Bundle: Microeconomic Theory: Basic Principles and Extensions, 12th + MindTap Economics, 1 term (6 months) Printed Access Card


- Wolfgang is a typical producer in a perfectly competitive piano industry (i.e., all other producers of pianos face the same costs as Wolfgang). The following production and cost data apply to the long run as well as the short run. Fixed costs (rent) are unrecoverable in the short run and are equal to $2400 per month. Variable costs consist of raw materials (wire, wood, plastic), which cost $1000 per piano, and the $40 per hour opportunity cost of Wolfgang's time. Wolfgang's production function is given in the table at right. Wolfgang will shut down if the price per piano is less than OA. $3000. B. $4000. O C. $5000. ○ D. None of the above. Pianos (Q) Hours (L) Raw Materials ( 0 0 0 1 100 1000 2 150 2000 3 240 3000 4 400 4000arrow_forwardP2 P₁ $ per unit Using the graph below, determine which statement is TRUE. MC1 SRATC₁ Q1 Q₂ MC2 SRATC2 LRAC ✓ LEA Quantityarrow_forwardUsing the grapns below, wnicn snow the snort-run cost curves for 3 perfectly competitive firms in the same industry, determine whether the industry is in long-run equilibrium or not. Q Q Firm A QA MC ATC Output Firm B QB MC ATC Firm C MC ATC Output Output Qc If Firms A, B and C are in the same industry, is this industry in long-run equilibrium? ○ A. Yes, because P = MC = MR for each of the 3 firms. ○ B. No, because Firm A is not producing at a profit-maximizing level of output. ○ C. Yes, because all 3 firms are producing at their minimum average total cost. OD. The answer is uncertain since it's unknown whether the firms are producing at the minimum efficient scale or not. ○ E. No, because if the industry were in equilibrium, all 3 firms would be earning zero economic profits.arrow_forward
- Consider the table on the right, which shows the various revenue concepts for a perfectly competitive firm. Suppose the firm faces a constant market price of $4. Compute first total revenue for each level of output and fill in the TR column of the table. Next, compute marginal revenue for each level of output and fill in the MR column of the table. (Marginal revenue at each level of output is computed using total revenue for two successive levels of output. For example, marginal revenue at 160 uses total revenue for output levels 120 and 160.) Total Marginal Price (p)Quantity (Q) Revenue (TR)Revenue (MR) $4 A EA 120 $4 160 $4 200 $4 240 $4 280 $ EA EA EA 10 S คarrow_forwardThis week we will be discussing measures of economic well-being. Read the following short article from the Office of National Statistics from the U.K. which discusses different measures of economic well-being: https://blog.ons.gov.uk/2017/07/06/beyond-gdp-measuring-the-economic-well-being-of-individuals/ For this assignment, we will narrow down to the economic well-being of the St. Louis region (or another region you choose). As the article indicates there are different measures of well-being. You are interested in creating a Hypothesis Test about the economic well-being of the area. Discuss the following issues: First, think about your research hypothesis and justify it briefly. Remember, a hypothesis is a well-thought and untested proposition. What is the null hypothesis? What is the parameter you are interested in? (i.e., the measure of well-being). Is it going to be a Lower-Tail, Upper-Tail or Two-Tailed test? What is the data that you need and how will you collect the data? What…arrow_forwardJohnny brought $39.50 to the art supply store. He bought a brush, a sketchbook, and a paint set. The brush was 1 6 as much as the sketchbook, and the sketchbook cost 3 4 the cost of the paint set. Johnny had $2.00 left over after buying these items.arrow_forward
- A young woman plans to retire early in 25 years. She believes she can save $10,000 each year starting now. If she plans to begin withdrawing money one year after she makes her last payment into the retirement account (i.e., in the 26th year), what uniform amount could she withdraw each year for 30 years, if the account earns an interest rate of 8% per year? a) Correctly plot the cash flow diagram with its respective vectors, arrowheads, units, and currency values. b) Correct mathematical approach and development, use of compound interest factors.c) Financial logic in the development of the exercise and application of the concept of time value of money. d) Final numerical answer and writing in prose with a minimum of 20 words and a maximum of 50 words of the obtained numerical interpretation.arrow_forwardA hospital charges $200 for a medical procedure, and 1,000 patients use the service. The hospital raises the price to $250, and the number of patients drops to 900. Calculate the price elasticity of demand (PED) and explain your answer. (show all working) Briefly explain how elasticity affects government health policies in the following cases: • Taxes on unhealthy products (cigarettes, alcohol, sugary drinks) • Subsidizing Preventive Care (e.g., vaccines, screenings) Drug Price Controls & Generic Substitutions Co-Payments & Insurance Designarrow_forwardAssume the United States is a large consumer of steel, able to influence the world price. DUS and SUS denote its demand and supply schedules in Figure 1. The overall (United States plus world) supply schedule of steel is denoted by SUS.+W. Figure 1 Import Tariff Levied by a Large Country Answer all questions (a-f) by referring to Figure 1 above. a) Calculate the free trade market equilibrium price, domestic consumption, and volumE Answer all questions (a-f) by referring to Figure 1 above. a) Calculate the free trade market equilibrium price, domestic consumption, and volume of steel imports by the US. [5 marks] b) Suppose the United States imposes a tariff (t) of $100 on each ton of steel imported. With the tariff, calculate the price of steel and the volume of steel imports by the US. [5 marks] c) Of the $100 tariff, how much is passed on to the US consumer via a higher price, and how much is borne by the foreign exporter? [5 marks] d) Calculate the tariff's deadweight welfare loss to…arrow_forward
- 1. A doctor quits his job, which pays $77,000 per annum, to open a non-governmental organization (NGO) to serve the needs of orphans. His annual expenses for the NGO amounts to $62,700 for food and daily supplies, $9,400 for maintenance, and $1,800 for books. What is his opportunity cost of opening the NGO? (Show working) 2. During the COVID-19 pandemic, hospitals worldwide faced severe resource constraints, including: a. Limited ICU beds b. Shortage of ventilators c. Insufficient doctors and nurses d. Lack of vaccines in early 2021 Governments and hospitals had to make critical decisions about who receives treatment first and how to allocate limited resources efficiently. In no more than 150 words and using core economic concepts of scarcity, choice and opportunity cost, how would you help your government make these critical decisions?arrow_forwardWhat is the argument about necessary evil?arrow_forwardWhat are the consequences of declining houses prices?arrow_forward

 Economics (MindTap Course List)EconomicsISBN:9781337617383Author:Roger A. ArnoldPublisher:Cengage Learning
 Microeconomics: Principles & PolicyEconomicsISBN:9781337794992Author:William J. Baumol, Alan S. Blinder, John L. SolowPublisher:Cengage Learning
