Subpart (a):
Calculate the member of required labor.
Subpart (a):
Explanation of Solution
Number of workers required to produce one unit of goods can be calculated using the following formula.
Substitute the respective values in Equation (1) to calculate the required number of person to produce one unit of car in U.S.
Required labor to produce one unit of car in U.S. is 0.25.
Table 1 illustrates the workers required to produce a car and a ton of grain in the U.S. and the Japan that obtained by using Equation (1).
Table 1
| Workers required to produce | ||
| One Car | One Ton of Grain | |
| U.S. | 0.25 workers | 0.10 workers |
| Japan | 0.25 workers | 0.20 workers |
Concept introduction:
Subpart (b):
Draw the production possibility frontier.
Subpart (b):
Explanation of Solution
Figure 1 shows the productive capacity of two countries.
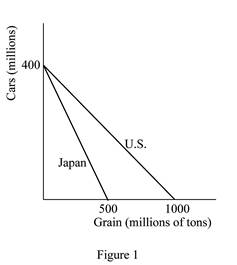
In Figure 1, the horizontal axis measures the quantity of grains produced by both the countries and the vertical axis measures the quantity of cars produced. If either economy, that is, the U.S. or Japan devotes all of its 100 million workers in producing cars each economy can produce 400 million cars in a year
Concept introduction:
Production Possibility Frontier (PPF): PPF refers to the maximum possible combinations of output of goods or services that an economy can attain by efficiently utilizing and employing full resources.
Subpart (c):
Calculate the opportunity cost.
Subpart (c):
Explanation of Solution
Opportunity cost of a car for the U.S. is calculated as follows.
Thus, the opportunity cost of a car for the U.S. is 2.5 tons of grains.
Opportunity cost of a car for Japan is calculated as follows.
Thus, the opportunity cost of a car for Japan is 1.25 tons of grains.
Opportunity cost of producing a ton of grains in the U.S. is calculated as follows
Thus, the opportunity cost of producing a ton of grains in the U.S. is 0.4 units of cars.
Opportunity cost of producing a ton of grains in Japan is calculated as follows.
Thus, the opportunity cost of producing a ton of grains in Japan is 0.8 units of cars.
The results can be tabulated in Table 2 below.
Table 2
| Opportunity Cost | ||
| One Car | One Ton of Grain | |
| U.S. | 2.5 tons of grains | 0.4 units of car |
| Japan | 1.25 tons of grains | 0.8 units of car |
Concept introduction:
Opportunity cost: Opportunity cost is the cost of a foregone alternative, that is, the loss of other alternative when one alternative is chosen.
Subpart (d):
Find the country that has absolute advantage in the production of goods.
Subpart (d):
Explanation of Solution
Neither of these countries has an absolute advantage in producing cars. This is because they are equally productive in the production of a car (4 cars per worker per year). However, in the production of grains, the United States has an absolute advantage because it is more productive than Japan. The U.S. can produce 10 tons of grains per worker per year; whereas Japan can produce only 5 tons of grains per worker per year.
Concept introduction:
Absolute advantage: It is the ability to produce a good using fewer inputs than another producer.
Subpart (e):
Find the country that has absolute advantage in the production of goods.
Subpart (e):
Explanation of Solution
Japan has a
Concept introduction:
Comparative advantage: It refers to the ability to produce a good at a lower opportunity cost than another producer.
Subpart (f):
Calculate the total production before the trade.
Subpart (f):
Explanation of Solution
Without trade and with half the workers in each country producing each of the goods, the United States would produce 200 million cars
Concept introduction:
Trade: The trade refers to the exchange of capital, goods, and services across different countries.
Subpart (g):
Gains from trade for the U.S. and Japan.
Subpart (g):
Explanation of Solution
Firstly, consider the situation without trade in which each country is producing some cars and some grains. Suppose the United States shifts its one worker from producing cars to producing grain, then that worker would produce 4 cars and 10 additional tons of grain. Now suppose, with trade, the United States offers to trade 7 tons of grain to Japan for 4 cars. The United States would encourage this because the cost of producing 4 cars in the United States is 10 tons of grain. So by trading, the United States can gain 4 cars for a cost of only 7 tons of grain. Hence, it is better off by 3 tons of grain.
The same is applicable for Japan, if Japan changes one worker from producing grain to producing cars. That worker would produce 4 more cars and 5 fewer tons of grain. Japan will take the trade because Japan will be better off by 2 tons of grain.
So with the trade and the change of one worker in both the United States and Japan, each country gets the same amount of cars as before but gets additional tons of grain (3 tons of grains for the United States and 2 tons of grains for Japan) making both countries better off.
Concept introduction:
Trade: The trade refers to the exchange of capital, goods, and services across different countries.
Want to see more full solutions like this?
Chapter 3 Solutions
Principles of Macroeconomics (MindTap Course List)

- What happens to consumer surplus and producer surplus when the sale of a good is taxed?arrow_forwardEconomics Grade 3 CONDUCT RESEARCH ON (the various) MARKET STRUCTURES Research Project/May Explain the concept market structure and explain why there are perfect and imperfect market structures. (5) • Provide reasons as to why the taxi industry is regarded as operating in a monopolistic competitive structure. (10) • How do monopolies impact consumers and the economy. (10) • Use graph(s) to explain the long run equilibrium price and output in a perfect market. (10) • Evaluate the effectiveness of South Africa's competition policy in curbing anticompetitive tendencies in the market. Make use of practical examples. (10) GRAND TOTAL:50 Please turn Copyrightarrow_forwardUGD KCQ 2: Microeconomic Essentials (page 11 of 20) - Google Chrome mancosaconnect.ac.za/mod/quiz/attempt.php?attempt=1958913&cmid=436375&page=10 MANCOSA Microeconomic Essentials Jan25 Y1 S1 Back Refer to the diagram below to answer the question that follows: Price PH P1 D₁ ㅁ X Quiz navigation 3 4 5 6 Time left 0:58:34 1 2 Question 11 7 8 Not yet answered Marked out of 1.00 13 33 14 S₁ Flag question Q Q1 Quantity Which of the following may result in a shift of the supply curve from S to S1? OA. An increase in price of the good. B. An increase in wages. O C. A decrease in price of the good. O D. An improvement in the technique of production. https://mancosaconnect.ac.za/mod/quiz/attempt.php?attempt=1958913&cmid=436375&page=10#question-2064270-11 19 20 6 10 10 11 12 15 Question 11- Not yet answered Finish attempt... 7:31 PMarrow_forward
- Euros per U.S. Doler Consider the model below, showing the supply and demand curves for the exchange market of U.S. Dollars and Euros. If the inflation rate in the U.S. increases (and in the European Union stays the same), how will that change the original equilibrium shown in the graph? 1.10- 1.00- 0.90 0.80- 0.70 0.60 0.50- 0.40- 0.30 0.20 E 4.7 48 49 50 51 52 53 54 55 56 Quantity of U.S. Dollars traded for Euros (trillionsday) O It will decrease the demand for Dollars and increase the supply, so the exchange rate decreases and the impact on the quantity traded is unknown. O It will decrease the demand for Dollars and increase the supply, so the exchange rate decreases, and the quantity traded increases. It will increase the demand for Dollars and decrease the supply, so the exchange rate decreases, and the quantity traded increases. It will increase the demand for Dollars and decrease the supply, so the exchange rate increases and the impact on the quantity traded is unknownarrow_forwardIf the US Federal Reserve increases interests on reserves, how will that change the original equilibrium shown in the graph? Euros par US alar 1.10 1.00 0.90- E 0.80- 0.70 0.60 0.50 0.40- 0.30 0.20 47 48 49 50 51 52 53 54 55 56 Quantity of US Dollars traded for Euros (trillions/day) It will increase the demand for Dollars and decrease the supply, so the exchange rate decreases, and the quantity traded increases. O It will decrease the demand for Dollars and increase the supply, so the exchange rate decreases and the impact on the quantity traded is unknown. O It will increase the demand for Dollars and decrease the supply, so the exchange rate increases and the impact on the quantity traded is unknown O It will decrease the demand for Dollars and increase the supply, so the exchange rate decreases, and the quantity traded increases. Question 22 5 ptsarrow_forward1. Based on the video, answer the following questions. • What are the 5 key characteristics that differentiate perfect competition from monopoly? Based on the video. • How does the number of sellers in a market influence the type of market structure? Based on the video. • In what ways does product differentiation play a role in monopolistic competition? Based on the video. • How do barriers to entry affect the level of competition in an oligopoly? Based on the video. • Why might firms in an oligopolistic market engage in non-price competition rather than price wars? Based on the video. Reference video: https://youtu.be/Qrr-IGR1kvE?si=h4q2F1JFNoCI36TVarrow_forward
- 1. Answer the following questions based on the reference video below: • What are the 5 key characteristics that differentiate perfect competition from monopoly? • How does the number of sellers in a market influence the type of market structure? • In what ways does product differentiation play a role in monopolistic competition? • How do barriers to entry affect the level of competition in an oligopoly? • Why might firms in an oligopolistic market engage in non-price competition rather than price wars? Discuss. Reference video: https://youtu.be/Qrr-IGR1kvE?si=h4q2F1JFNoCI36TVarrow_forwardExplain the importance of differential calculus within economics and business analysis. Provide three refernces with your answer. They can be from websites or a journals.arrow_forwardAnalyze the graph below, showing the Gross Federal Debt as a percentage of GDP for the United States (1939-2019). Which of the following is correct? FRED Gross Federal Debt as Percent of Gross Domestic Product Percent of GDP 120 110 100 60 50 40 90 30 1940 1950 1960 1970 Shaded areas indicate US recessions 1980 1990 2000 2010 1000 Sources: OMD, St. Louis Fed myfred/g/U In 2019, the Federal Government of the United States had an accumulated debt/GDP higher than 100%, meaning that the amount of debt accumulated over time is higher than the value of all goods and services produced in that year. The debt/GDP is always positive during this period, so the Federal Government of the United States incurred in budget deficits every year since 1939. From the mid-40s until the mid-70s, the debt/DGP was decreasing, meaning that the Federal Government of the United States was running a budget surplus every year during those three decades. During the second half of the 1970s, the Federal Government…arrow_forward
- An imaginary country estimates that their economy can be approximated by the AD/AS model below. How can this government act to move the equilibrium to potential GDP? LRAS Price Level P Y Real GDP E SRAS AD The AD/AS model shows that a contractionary fiscal policy is suitable, but the choice of increasing taxes, decreasing government expenditure or doing both simultaneously is mostly political The AD/AS model shows that increasing taxes is the best fiscal policy available. The AD/AS model shows that decreasing government expenditure is the best fiscal policy available. The AD/AS model shows that an expansionary fiscal policy capable of shifting the AD curve to the potential GDP level would decrease Real GDP but increase inflationary pressuresarrow_forwardQuestion 1 Coursology Consider the four policies bellow. Classify them as either fiscal or monetary policy: I. The United States Government promoting tax cuts for small businesses to prevent a wave of bankruptcies during the COVID-19 pandemic II. The Congress approving a higher budget for the Affordable Health Care Act (also known as Obamacare) III. The Federal Reserve increasing the required reserves for commercial banks aiming to control the rise of inflation IV. President Joe Biden approving a new round of stimulus checks for households I. fiscal, II. fiscal, III. monetary, IV. fiscal I. fiscal, II. monetary, III. monetary, IV. monetary I. monetary, II. fiscal, III. fiscal, IV. fiscal I. monetary, II. monetary, III. fiscal, IV. monetaryarrow_forwardConsider the following supply and demand schedule of wooden tables.a. Draw the corresponding graphs for supply and demand.b. Using the data, obtain the corresponding supply and demand functions. c. Find the market-clearing price and quantity. Price (Thousand s USD Supply Demand 2 96 1104 196 1906 296 2708 396 35010 496 43012 596 51014 696 59016 796 67018 896 75020…arrow_forward
 Brief Principles of Macroeconomics (MindTap Cours...EconomicsISBN:9781337091985Author:N. Gregory MankiwPublisher:Cengage Learning
 Essentials of Economics (MindTap Course List)EconomicsISBN:9781337091992Author:N. Gregory MankiwPublisher:Cengage Learning


