Subpart (a):
Calculate the member of required labor.
Subpart (a):
Explanation of Solution
Number of workers required to produce one unit of goods can be calculated using the following formula.
Substitute the respective values in Equation (1) to calculate the required number of person to produce one unit of car in U.S.
Required labor to produce one unit of car in U.S. is 0.25.
Table 1 illustrates the workers required to produce a car and a ton of grain in the U.S. and the Japan that obtained by using Equation (1).
Table 1
| Workers required to produce | ||
| One Car | One Ton of Grain | |
| U.S. | 0.25 workers | 0.10 workers |
| Japan | 0.25 workers | 0.20 workers |
Concept introduction:
Subpart (b):
Draw the production possibility frontier.
Subpart (b):
Explanation of Solution
Figure 1 shows the productive capacity of two countries.
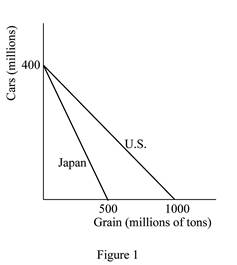
In Figure 1, the horizontal axis measures the quantity of grains produced by both the countries and the vertical axis measures the quantity of cars produced. If either economy, that is, the U.S. or Japan devotes all of its 100 million workers in producing cars each economy can produce 400 million cars in a year
Concept introduction:
Production Possibility Frontier (PPF): PPF refers to the maximum possible combinations of output of goods or services that an economy can attain by efficiently utilizing and employing full resources.
Subpart (c):
Calculate the opportunity cost.
Subpart (c):
Explanation of Solution
Opportunity cost of a car for the U.S. is calculated as follows.
Thus, the opportunity cost of a car for the U.S. is 2.5 tons of grains.
Opportunity cost of a car for Japan is calculated as follows.
Thus, the opportunity cost of a car for Japan is 1.25 tons of grains.
Opportunity cost of producing a ton of grains in the U.S. is calculated as follows
Thus, the opportunity cost of producing a ton of grains in the U.S. is 0.4 units of cars.
Opportunity cost of producing a ton of grains in Japan is calculated as follows.
Thus, the opportunity cost of producing a ton of grains in Japan is 0.8 units of cars.
The results can be tabulated in Table 2 below.
Table 2
| Opportunity Cost | ||
| One Car | One Ton of Grain | |
| U.S. | 2.5 tons of grains | 0.4 units of car |
| Japan | 1.25 tons of grains | 0.8 units of car |
Concept introduction:
Opportunity cost: Opportunity cost is the cost of a foregone alternative, that is, the loss of other alternative when one alternative is chosen.
Subpart (d):
Find the country that has absolute advantage in the production of goods.
Subpart (d):
Explanation of Solution
Neither of these countries has an absolute advantage in producing cars. This is because they are equally productive in the production of a car (4 cars per worker per year). However, in the production of grains, the United States has an absolute advantage because it is more productive than Japan. The U.S. can produce 10 tons of grains per worker per year; whereas Japan can produce only 5 tons of grains per worker per year.
Concept introduction:
Absolute advantage: It is the ability to produce a good using fewer inputs than another producer.
Subpart (e):
Find the country that has absolute advantage in the production of goods.
Subpart (e):
Explanation of Solution
Japan has a
Concept introduction:
Comparative advantage: It refers to the ability to produce a good at a lower opportunity cost than another producer.
Subpart (f):
Calculate the total production before the trade.
Subpart (f):
Explanation of Solution
Without trade and with half the workers in each country producing each of the goods, the United States would produce 200 million cars
Concept introduction:
Trade: The trade refers to the exchange of capital, goods, and services across different countries.
Subpart (g):
Gains from trade for the U.S. and Japan.
Subpart (g):
Explanation of Solution
Firstly, consider the situation without trade in which each country is producing some cars and some grains. Suppose the United States shifts its one worker from producing cars to producing grain, then that worker would produce 4 cars and 10 additional tons of grain. Now suppose, with trade, the United States offers to trade 7 tons of grain to Japan for 4 cars. The United States would encourage this because the cost of producing 4 cars in the United States is 10 tons of grain. So by trading, the United States can gain 4 cars for a cost of only 7 tons of grain. Hence, it is better off by 3 tons of grain.
The same is applicable for Japan, if Japan changes one worker from producing grain to producing cars. That worker would produce 4 more cars and 5 fewer tons of grain. Japan will take the trade because Japan will be better off by 2 tons of grain.
So with the trade and the change of one worker in both the United States and Japan, each country gets the same amount of cars as before but gets additional tons of grain (3 tons of grains for the United States and 2 tons of grains for Japan) making both countries better off.
Concept introduction:
Trade: The trade refers to the exchange of capital, goods, and services across different countries.
Want to see more full solutions like this?
Chapter 3 Solutions
Principles Of Economics, Ap Edition, 9781337292603, 1337292605, 2018

- how commond economies relate to principle Of Economics ?arrow_forwardCritically analyse the five (5) characteristics of Ubuntu and provide examples of how they apply to the National Health Insurance (NHI) in South Africa.arrow_forwardCritically analyse the five (5) characteristics of Ubuntu and provide examples of how they apply to the National Health Insurance (NHI) in South Africa.arrow_forward
- Outline the nine (9) consumer rights as specified in the Consumer Rights Act in South Africa.arrow_forwardIn what ways could you show the attractiveness of Philippines in the form of videos/campaigns to foreign investors? Cite 10 examples.arrow_forwardExplain the following terms and provide an example for each term: • Corruption • Fraud • Briberyarrow_forward
- In what ways could you show the attractiveness of a country in the form of videos/campaigns?arrow_forwardWith the VBS scenario in mind, debate with your own words the view that stakeholders are the primary reason why business ethics must be implemented.arrow_forwardThe unethical decisions taken by the VBS management affected the lives of many of their clients who trusted their business and services You are appointed as an ethics officer at Tyme Bank. Advise the management regarding the role of legislation in South Africa in providing the legal framework for business operations.arrow_forward
- Tyme Bank is a developing bank in South Africa and could potentially encounter challenges similar to those faced by VBS in the future. Explain five (5) benefits of applying business ethics at Tyme Bank to prevent similar ethical scandals.arrow_forward1.3. Explain the five (5) ethical challenges that can be associated with the implementation of the National Health Insurance (NHI) in South Africa.arrow_forward1.2. Fourie (2018:211) suggests that Ubuntu emphasises the willingness to share and participate in a community. However, it does not privilege the community over the dignity and life of the individual. With the above in mind, discuss how the implementation of the National Health Insurance (NHI) is a way to uphold the concept of Ubuntu.arrow_forward
 Brief Principles of Macroeconomics (MindTap Cours...EconomicsISBN:9781337091985Author:N. Gregory MankiwPublisher:Cengage Learning
 Essentials of Economics (MindTap Course List)EconomicsISBN:9781337091992Author:N. Gregory MankiwPublisher:Cengage Learning


