Subpart (a):
Calculate the member of required labor.
Subpart (a):
Explanation of Solution
Number of workers required to produce one unit of goods can be calculated using the following formula.
Substitute the respective values in Equation (1) to calculate the required number of person to produce one unit of car in U.S.
Required labor to produce one unit of car in U.S. is 0.25.
Table 1 illustrates the workers required to produce a car and a ton of grain in the U.S. and the Japan that obtained by using Equation (1).
Table 1
| Workers required to produce | ||
| One Car | One Ton of Grain | |
| U.S. | 0.25 workers | 0.10 workers |
| Japan | 0.25 workers | 0.20 workers |
Concept introduction:
Subpart (b):
Draw the production possibility frontier.
Subpart (b):
Explanation of Solution
Figure 1 shows the productive capacity of two countries.
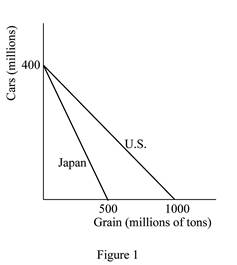
In Figure 1, the horizontal axis measures the quantity of grains produced by both the countries and the vertical axis measures the quantity of cars produced. If either economy, that is, the U.S. or Japan devotes all of its 100 million workers in producing cars each economy can produce 400 million cars in a year
Concept introduction:
Production Possibility Frontier (PPF): PPF refers to the maximum possible combinations of output of goods or services that an economy can attain by efficiently utilizing and employing full resources.
Subpart (c):
Calculate the opportunity cost.
Subpart (c):
Explanation of Solution
Opportunity cost of a car for the U.S. is calculated as follows.
Thus, the opportunity cost of a car for the U.S. is 2.5 tons of grains.
Opportunity cost of a car for Japan is calculated as follows.
Thus, the opportunity cost of a car for Japan is 1.25 tons of grains.
Opportunity cost of producing a ton of grains in the U.S. is calculated as follows
Thus, the opportunity cost of producing a ton of grains in the U.S. is 0.4 units of cars.
Opportunity cost of producing a ton of grains in Japan is calculated as follows.
Thus, the opportunity cost of producing a ton of grains in Japan is 0.8 units of cars.
The results can be tabulated in Table 2 below.
Table 2
| Opportunity Cost | ||
| One Car | One Ton of Grain | |
| U.S. | 2.5 tons of grains | 0.4 units of car |
| Japan | 1.25 tons of grains | 0.8 units of car |
Concept introduction:
Opportunity cost: Opportunity cost is the cost of a foregone alternative, that is, the loss of other alternative when one alternative is chosen.
Subpart (d):
Find the country that has absolute advantage in the production of goods.
Subpart (d):
Explanation of Solution
Neither of these countries has an absolute advantage in producing cars. This is because they are equally productive in the production of a car (4 cars per worker per year). However, in the production of grains, the United States has an absolute advantage because it is more productive than Japan. The U.S. can produce 10 tons of grains per worker per year; whereas Japan can produce only 5 tons of grains per worker per year.
Concept introduction:
Absolute advantage: It is the ability to produce a good using fewer inputs than another producer.
Subpart (e):
Find the country that has absolute advantage in the production of goods.
Subpart (e):
Explanation of Solution
Japan has a
Concept introduction:
Comparative advantage: It refers to the ability to produce a good at a lower opportunity cost than another producer.
Subpart (f):
Calculate the total production before the trade.
Subpart (f):
Explanation of Solution
Without trade and with half the workers in each country producing each of the goods, the United States would produce 200 million cars
Concept introduction:
Trade: The trade refers to the exchange of capital, goods, and services across different countries.
Subpart (g):
Gains from trade for the U.S. and Japan.
Subpart (g):
Explanation of Solution
Firstly, consider the situation without trade in which each country is producing some cars and some grains. Suppose the United States shifts its one worker from producing cars to producing grain, then that worker would produce 4 cars and 10 additional tons of grain. Now suppose, with trade, the United States offers to trade 7 tons of grain to Japan for 4 cars. The United States would encourage this because the cost of producing 4 cars in the United States is 10 tons of grain. So by trading, the United States can gain 4 cars for a cost of only 7 tons of grain. Hence, it is better off by 3 tons of grain.
The same is applicable for Japan, if Japan changes one worker from producing grain to producing cars. That worker would produce 4 more cars and 5 fewer tons of grain. Japan will take the trade because Japan will be better off by 2 tons of grain.
So with the trade and the change of one worker in both the United States and Japan, each country gets the same amount of cars as before but gets additional tons of grain (3 tons of grains for the United States and 2 tons of grains for Japan) making both countries better off.
Concept introduction:
Trade: The trade refers to the exchange of capital, goods, and services across different countries.
Want to see more full solutions like this?

- 20. Factors 01 pro B. the technological innovations available to companies. A. the laws that regulate manufacturers. C. the resources used to create output D. the waste left over after goods are produced. 21. Table 1.1 shows the tradeoff between different combinations of missile production and home construction, ceteris paribus. Complete the table by calculating the required opportunity costs for both missiles and houses. Then answer the indicated question(s). Combination Number of houses Opportunity cost of houses in Number of missiles terms of missiles J 0 4 K 10,000 3 L 17,000 2 1 M 21,000 0 N 23,000 Opportunity cost of missiles in terms of houses Tutorials-Principles of Economics m health carearrow_forwardIn a small open economy with a floating exchange rate, the supply of real money balances is fixed and a rise in government spending ______ Group of answer choices Raises the interest rate so that net exports must fall to maintain equilibrium in the goods market. Cannot change the interest rate so that net exports must fall to maintain equilibrium in the goods market. Cannot change the interest rate so income must rise to maintain equilibrium in the money market Raises the interest rate, so that income must rise to maintain equilibrium in the money market.arrow_forwardSuppose a country with a fixed exchange rate decides to implement a devaluation of its currency and commits to maintaining the new fixed parity. This implies (A) ______________ in the demand for its goods and a monetary (B) _______________. Group of answer choices (A) expansion ; (B) contraction (A) contraction ; (B) expansion (A) expansion ; (B) expansion (A) contraction ; (B) contractionarrow_forward
- Assume a small open country under fixed exchanges rate and full capital mobility. Prices are fixed in the short run and equilibrium is given initially at point A. An exogenous increase in public spending shifts the IS curve to IS'. Which of the following statements is true? Group of answer choices A new equilibrium is reached at point B. The TR curve will shift down until it passes through point B. A new equilibrium is reached at point C. Point B can only be reached in the absence of capital mobility.arrow_forwardA decrease in money demand causes the real interest rate to _____ and output to _____ in the short run, before prices adjust to restore equilibrium. Group of answer choices rise; rise fall; fall fall; rise rise; fallarrow_forwardIf a country's policy makers were to continously use expansionary monetary policy in an attempt to hold unemployment below the natural rate , the long urn result would be? Group of answer choices a decrease in the unemployment rate an increase in the level of output All of these an increase in the rate of inflationarrow_forward
- A shift in the Aggregate Supply curve to the right will result in a move to a point that is southwest of where the economy is currently at. Group of answer choices True Falsearrow_forwardAn oil shock can cause stagflation, a period of higher inflation and higher unemployment. When this happens, the economy moves to a point to the northeast of where it currently is. After the economy has moved to the northeast, the Federal Reserve can reduce that inflation without having to worry about causing more unemployment. Group of answer choices True Falsearrow_forwardThe long-run Phillips Curve is vertical which indicates Group of answer choices that in the long-run, there is no tradeoff between inflation and unemployment. that in the long-run, there is no tradeoff between inflation and the price level. None of these that in the long-run, the economy returns to a 4 percent level of inflation.arrow_forward
- Suppose the exchange rate between the British pound and the U.S. dollar is £1 = $2.00. The U.S. government implementsU.S. government implements a contractionary fiscal policya contractionary fiscal policy. Illustrate the impact of this change in the market for pounds. 1.) Using the line drawing tool, draw and label a new demand line. 2.) Using the line drawing tool, draw and label a new supply line. Note: Carefully follow the instructions above and only draw the required objects.arrow_forwardJust Part D please, this is for environmental economicsarrow_forward3. Consider a single firm that manufactures chemicals and generates pollution through its emissions E. Researchers have estimated the MDF and MAC curves for the emissions to be the following: MDF = 4E and MAC = 125 – E Policymakers have decided to implement an emissions tax to control pollution. They are aware that a constant per-unit tax of $100 is an efficient policy. Yet they are also aware that this policy is not politically feasible because of the large tax burden it places on the firm. As a result, policymakers propose a two- part tax: a per unit tax of $75 for the first 15 units of emissions an increase in the per unit tax to $100 for all further units of emissions With an emissions tax, what is the general condition that determines how much pollution the regulated party will emit? What is the efficient level of emissions given the above MDF and MAC curves? What are the firm's total tax payments under the constant $100 per-unit tax? What is the firm's total cost of compliance…arrow_forward
 Brief Principles of Macroeconomics (MindTap Cours...EconomicsISBN:9781337091985Author:N. Gregory MankiwPublisher:Cengage Learning
 Essentials of Economics (MindTap Course List)EconomicsISBN:9781337091992Author:N. Gregory MankiwPublisher:Cengage Learning


