
Subparts (a):
The quantity supplied.
Given information:
Figure 1 shows the Supply curve ‘S1’ for tennis balls:
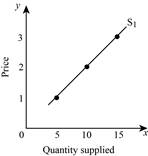
Table -1 shows the quantity supplied (S1 and S2) and its changes:
|
|
‘S1’ Quantity supplied | ‘S2’ Quantity supplied | Change in quantity supplied |
| 3 | - | 4 | - |
| 2 | - | 2 | - |
| 1 | - | 0 | - |
Subparts (b):
The quantity supplied.
Given information:
Figure 1 shows the Supply curve ‘S1’ for tennis balls:
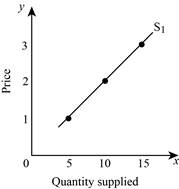
Table -1 shows the quantity supplied (S1 and S2) and its changes:
| Price |
‘S1’ Quantity supplied | ‘S2’ Quantity supplied | Change in quantity supplied |
| 3 | - | 4 | - |
| 2 | - | 2 | - |
| 1 | - | 0 | - |
Subparts (c):
The quantity supplied.
Given information:
Figure 1 shows the Supply curve ‘S1’ for tennis balls:

Table -1 shows the quantity supplied (S1 and S2) and its changes:
| Price |
‘S1’ Quantity supplied | ‘S2’ Quantity supplied | Change in quantity supplied |
| 3 | - | 4 | - |
| 2 | - | 2 | - |
| 1 | - | 0 | - |
Subparts (d):
The quantity supplied.
Given information:
Figure 1 shows the Supply curve ‘S1’ for tennis balls:

Table -1 shows the quantity supplied (S1 and S2) and its changes:
| Price |
‘S1’ Quantity supplied | ‘S2’ Quantity supplied | Change in quantity supplied |
| 3 | - | 4 | - |
| 2 | - | 2 | - |
| 1 | - | 0 | - |

Trending nowThis is a popular solution!

Chapter 3 Solutions
Macroeconomics: Principles, Problems, & Policies

- how commond economies relate to principle Of Economics ?arrow_forwardCritically analyse the five (5) characteristics of Ubuntu and provide examples of how they apply to the National Health Insurance (NHI) in South Africa.arrow_forwardCritically analyse the five (5) characteristics of Ubuntu and provide examples of how they apply to the National Health Insurance (NHI) in South Africa.arrow_forward
- Outline the nine (9) consumer rights as specified in the Consumer Rights Act in South Africa.arrow_forwardIn what ways could you show the attractiveness of Philippines in the form of videos/campaigns to foreign investors? Cite 10 examples.arrow_forwardExplain the following terms and provide an example for each term: • Corruption • Fraud • Briberyarrow_forward
- In what ways could you show the attractiveness of a country in the form of videos/campaigns?arrow_forwardWith the VBS scenario in mind, debate with your own words the view that stakeholders are the primary reason why business ethics must be implemented.arrow_forwardThe unethical decisions taken by the VBS management affected the lives of many of their clients who trusted their business and services You are appointed as an ethics officer at Tyme Bank. Advise the management regarding the role of legislation in South Africa in providing the legal framework for business operations.arrow_forward

 Exploring EconomicsEconomicsISBN:9781544336329Author:Robert L. SextonPublisher:SAGE Publications, Inc
 Microeconomics: Principles & PolicyEconomicsISBN:9781337794992Author:William J. Baumol, Alan S. Blinder, John L. SolowPublisher:Cengage Learning

 Economics (MindTap Course List)EconomicsISBN:9781337617383Author:Roger A. ArnoldPublisher:Cengage Learning