Videos
a.
Calculate the sales volume in units and dollars that is required to earn profit and prepare income statement.
a.
Explanation of Solution
The calculation of sales volume in units is as follows:
Hence, the sales volume in units is 6,000 units.
The calculation of sales volume in dollars is as follows:
Hence, the sales volume in dollars is $750,000.
The calculation of income statement is as follows:
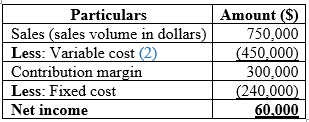
(Table 1)
Working note:
The calculation of contribution margin per unit is as follows:
Hence, the contribution margin per unit is $50.
(1)
The calculation of variable cost is as follows:
Hence, the variable cost is $450,000.
(2)
b.
Calculate the income statement and comment whether Company C should whether proceed with the plan.
b.
Explanation of Solution
The calculation of income statement is as follows:
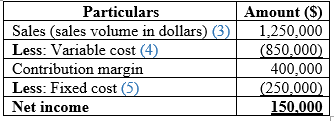
(Table 2)
Company V should continue with the plan to improve the quality of the product. As specified the project should add $90,000 to net income
Note:
The total number of units is 10,000 units
The variable cost is $85
Working note:
The calculation of sales volume in dollars is as follows:
Hence, the sales volume in dollars is $1,250,000.
(3)
The calculation of variable cost is as follows:
Hence, the variable cost is $850,000.
(4)
The calculation of total fixed cost is as follows:
Hence, the variable cost is $250,000.
(5)
c.
Calculate the margin of safety in dollars, units and as a percentage.
c.
Explanation of Solution
The calculation of break-even points in units is as follows:
Hence, the break-even units is 6,250 units.
The calculation of sales volume in dollars is as follows:
Hence, the sales volume in dollars is $781,250.
The calculation of margin of safety in dollars and units is as follows:
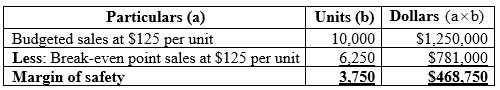
(Table 3)
The calculation of margin of safety in percentage is as follows:
Hence, the margin of safety in percentage is 37.5%
Working note:
The calculation of contribution margin per unit is as follows:
Hence, the contribution margin per unit is $40.
(6)
d.
Draw a break-even graph using the data in requirement (c).
d.
Explanation of Solution
The break-even graph is as follows:
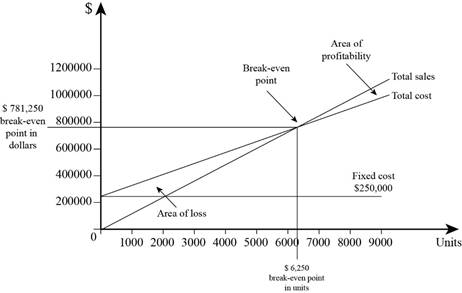
Figure 1
Want to see more full solutions like this?
Chapter 3 Solutions
Fundamental Managerial Accounting Concepts


 AccountingAccountingISBN:9781337272094Author:WARREN, Carl S., Reeve, James M., Duchac, Jonathan E.Publisher:Cengage Learning,
 Accounting Information SystemsAccountingISBN:9781337619202Author:Hall, James A.Publisher:Cengage Learning,
 Horngren's Cost Accounting: A Managerial Emphasis...AccountingISBN:9780134475585Author:Srikant M. Datar, Madhav V. RajanPublisher:PEARSON
 Intermediate AccountingAccountingISBN:9781259722660Author:J. David Spiceland, Mark W. Nelson, Wayne M ThomasPublisher:McGraw-Hill Education
 Financial and Managerial AccountingAccountingISBN:9781259726705Author:John J Wild, Ken W. Shaw, Barbara Chiappetta Fundamental Accounting PrinciplesPublisher:McGraw-Hill Education