
(a)
When the imported bananas are infected with a deadly virus what happens to the
Explanation of Solution
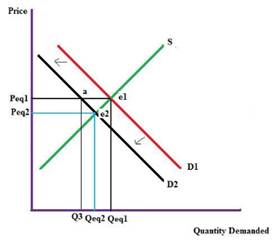
A report says that the bananas that have been imported are infected with a deadly virus, this will lead to the shift of consumers towards other fruits available in the market. Hence, the demand for the bananas will be less which will shift the demand curve towards left.
In the given graph, D1 is the initial demand curve, S is the initial supply curve, Peq1 is the initial
Demand and supply are the basic concepts in economics, and they can vary depending on various factors. Demand can be defined as how much quantity of the product or service is demanded or can be availed by a customer.
Whereas Supply how much quantity of products or services is available in the market.
(b)
When the consumers' income drops or decreases what happens to the demand and supply curve.
Explanation of Solution
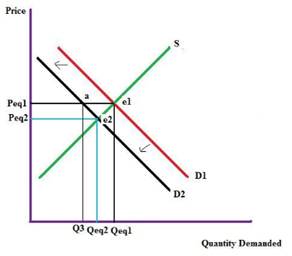
A fall in consumer income will reduce the demand as his disposable income, so demand curve shifts down, which in turn reduces the price of the product. In the given graph, D1 is the initial demand curve S is the initial supply curve, Peq1 is the initial price and Qeq1 is the initial quantity. Due to change in income demand curve shifts to the left to D2. Price Peq1 is same but demand come down i.e. Q3 which lower than Qeq1 creating a surplus in the market. This in turn shifts the price to a new equilibrium point e2 and price changes to Peq2.and quantity become Qeq2.
Demand and supply are the basic concepts in economics, and they can vary depending on various factors. Demand can be defined as how much quantity of the product or service is demanded or can be availed by a customer.
Whereas Supply how much quantity of products or services is available in the market.
(c)
When the price of banana rises what happens to the demand and supply curve.
Explanation of Solution
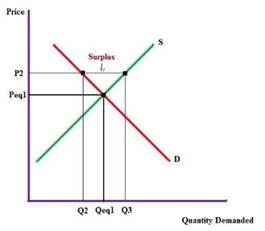
Demand is function of price and the quantity demanded. Hence, demand curve shifts when there is variation in the price and quantity demanded of the product. When price of banana rises quantity demanded will fall, which will create a surplus in the market.
Demand and supply are the basic concepts in economics, and they can vary depending on various factors. Demand can be defined as how much quantity of the product or service is demanded or can be availed by a customer.
Whereas Supply how much quantity of products or services is available in the market.
(d)
When the price of oranges falls what happens to the demand and supply curve.
Explanation of Solution
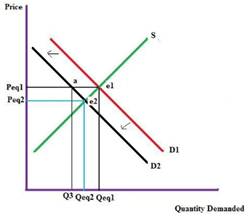
Oranges are a substitute to bananas. As the price of oranges fall, it causes a shift in the consumers preference. They start consuming more oranges than bananas. So, the quantity demanded for bananas fall and the demand curve of bananas shifts toward left reducing the price and consumption. Hence, at the new equilibrium point e2 price is reduced to Peq2 and quantity id reduced to Qeq2.
Demand and supply are the basic concepts in economics, and they can vary depending on various factors. Demand can be defined as how much quantity of the product or service is demanded or can be availed by a customer.
Whereas Supply how much quantity of products or services is available in the market.
(e)
When the consumers assume the price of bananas to fall in future what happens to the demand and supply curve.
Explanation of Solution

When consumers feel the price of bananas would fall in future, they would stop the consumption of bananas at the current price creating a surplus in the market. This would lead to reduction in price of the bananas. At the new point of
Demand and supply are the basic concepts in economics, and they can vary depending on various factors. Demand can be defined as how much quantity of the product or service is demanded or can be availed by a customer.
Whereas Supply how much quantity of products or services is available in the market.
Want to see more full solutions like this?

- The following diagram illustrates the demand and marginal revenue curves facing a monopoly in an industry with no economies or diseconomies of scale. In the short and long run, MC = ATC. a. Calculate the values of profit, consumer surplus, and deadweight loss, and illustrate these on the graph. b. Repeat the calculations in part a, but now assume the monopoly is able to practice perfect price discrimination.arrow_forwardThe projects under the 'Build, Build, Build' program: how these projects improve connectivity and ease of doing business in the Philippines?arrow_forwardhow utillity relate to microeconomics ?arrow_forward
- How Command Economics Relate to Principle Of Economics?arrow_forwardhow commond economies relate to principle Of Economics ?arrow_forwardCritically analyse the five (5) characteristics of Ubuntu and provide examples of how they apply to the National Health Insurance (NHI) in South Africa.arrow_forward
- Critically analyse the five (5) characteristics of Ubuntu and provide examples of how they apply to the National Health Insurance (NHI) in South Africa.arrow_forwardOutline the nine (9) consumer rights as specified in the Consumer Rights Act in South Africa.arrow_forwardIn what ways could you show the attractiveness of Philippines in the form of videos/campaigns to foreign investors? Cite 10 examples.arrow_forward
 Economics (MindTap Course List)EconomicsISBN:9781337617383Author:Roger A. ArnoldPublisher:Cengage Learning

 Microeconomics: Private and Public Choice (MindTa...EconomicsISBN:9781305506893Author:James D. Gwartney, Richard L. Stroup, Russell S. Sobel, David A. MacphersonPublisher:Cengage Learning
 Macroeconomics: Private and Public Choice (MindTa...EconomicsISBN:9781305506756Author:James D. Gwartney, Richard L. Stroup, Russell S. Sobel, David A. MacphersonPublisher:Cengage Learning
 Economics: Private and Public Choice (MindTap Cou...EconomicsISBN:9781305506725Author:James D. Gwartney, Richard L. Stroup, Russell S. Sobel, David A. MacphersonPublisher:Cengage Learning