
Concept explainers
Videos
The motion picture industry is an extremely competitive business. Dozens of movie studios produce hundreds of movies each year, many of which cost hundreds of millions of dollars to produce and distribute. Some of these movies will go on to earn hundreds of millions of dollars in box office revenues, while others will earn much less than their production cost.
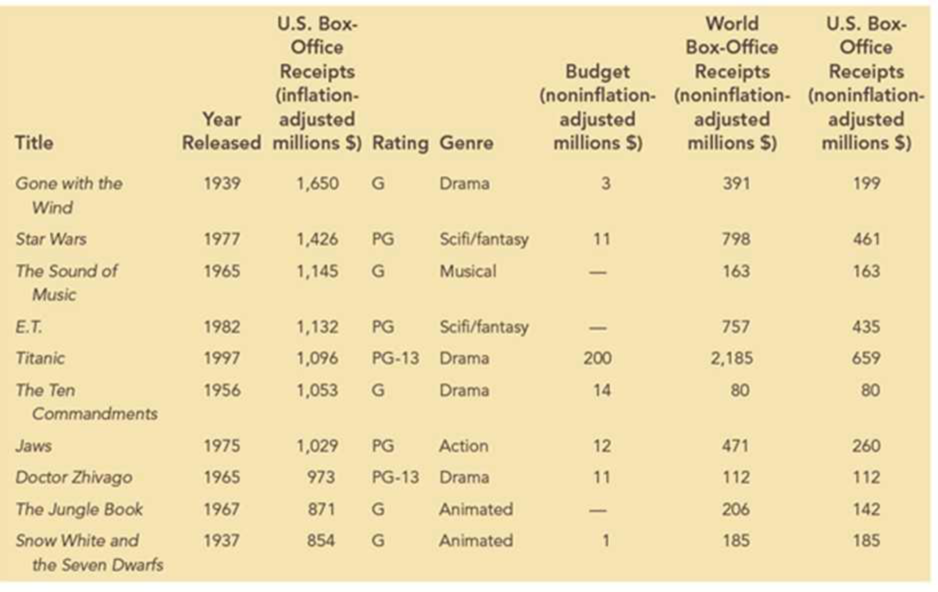
Data from 50 of the top box-office-receipt-generating movies are provided in the file Top50Movies. The following table shows the first 10 movies contained in this data set. The categorical variables included in the data set for each movie are the rating and genre. Quantitative variables for the movie’s release year, inflation- and noninflation-adjusted box-office receipts in the United States, budget, and the world box-office receipts are also included.
Managerial Report
Use the data-visualization methods presented in this chapter to explore these data and discover relationships between the variables. Include the following in your report:
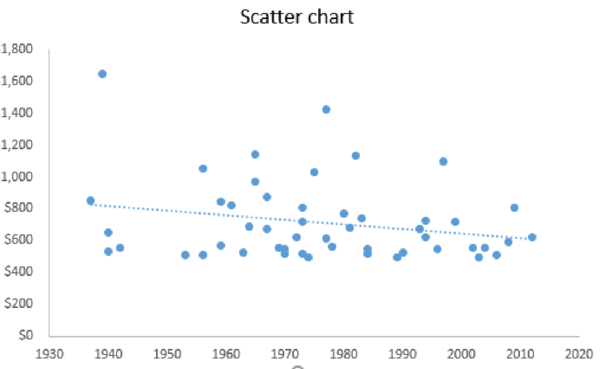
- 1. Create a scatter chart to examine the relationship between the year released and the inflation-adjusted U.S. box office receipts. Include a trendline for this scatter chart. What does the scatter chart indicate about inflation-adjusted U.S. box office receipts over time for these top 50 movies?
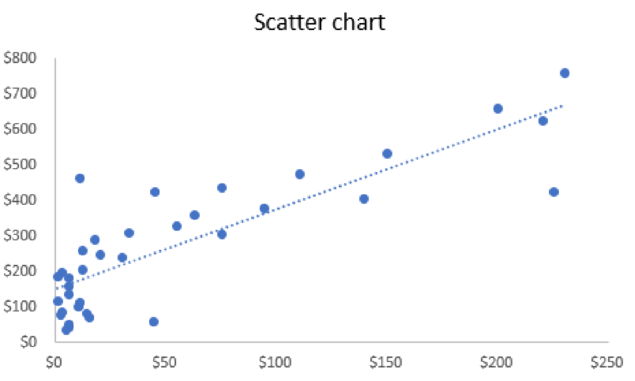
- 2. Create a scatter chart to examine the relationship between the budget and the noninflation-adjusted world box office receipts. (Note: You may have to adjust the data in Excel to ignore the missing budget data values to create your scatter chart. You can do this by first sorting the data using Budget and then creating a scatter chart using only the movies that include data for Budget.) What does this scatter chart indicate about the relationship between the movie’s budget and the world box office receipts?
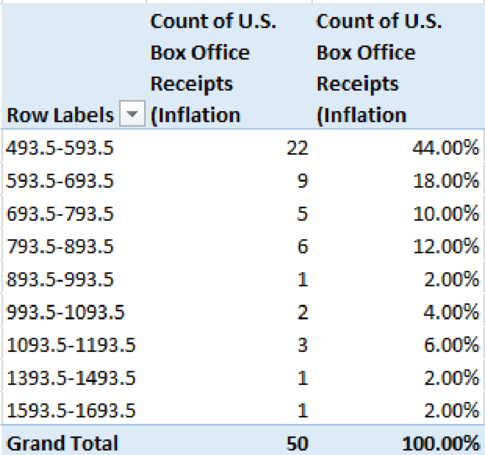
- 3. Create a frequency distribution, percent frequency distribution, and histogram for inflation-adjusted U.S. box office receipts. Use bin sizes of $100 million. Interpret the results. Do any data points appear to be outliers in this distribution?
- 4. Create a PivotTable for these data. Use the PivotTable to generate a crosstabulation for movie genre and rating. Determine which combinations of genre and rating are most represented in the top 50 movie data. Now filter the data to consider only movies released in 1980 or later. What combinations of genre and rating are most represented for movies after 1980? What does this indicate about how the preferences of moviegoers may have changed over time?
- 5. Use the PivotTable to display the average inflation-adjusted U.S. box-office receipts for each genre–rating pair for all movies in the data set. Interpret the results.
1. Give a scatter chart to examine the relationship between the year released and the inflation-adjusted U.S. box office receipts.
2. Give a scatter chart to examine the relationship between the budget and the noninflation-adjusted world box office receipts.
3. Construct a frequency distribution, percent frequency distribution, and histogram for inflation-adjusted U.S. box office receipts. Give interpretation of the results.
4. Construct crosstabulation for movie genre and rating. Find the combinations of genre and rating that are most represented in the top 50 movie data. Find the combinations of genre that are most represented for movies after 1980.
5. Construct the average inflation-adjusted U.S. box-office receipts for genre-rating pair for all movies in the data set using a PivotTable. Give interpretation.
Answer to Problem 1C
1. The scatter chart of the year released and the inflation-adjusted U.S. box office receipts are as follows:
2. The scatter chart to examine the relationship between the budget and the noninflation-adjusted world box office receipts is as follows:
3. The frequency distribution and percent frequency distribution for inflation-adjusted U.S. box office receipts are given below:
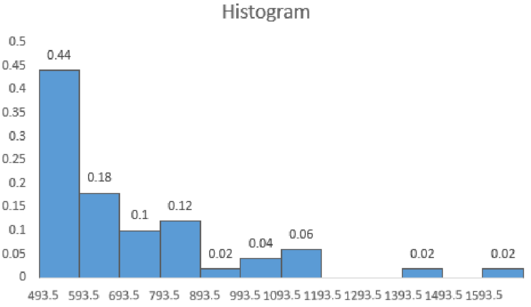
The histogram for inflation-adjusted U.S. box office receipts using an Excel:
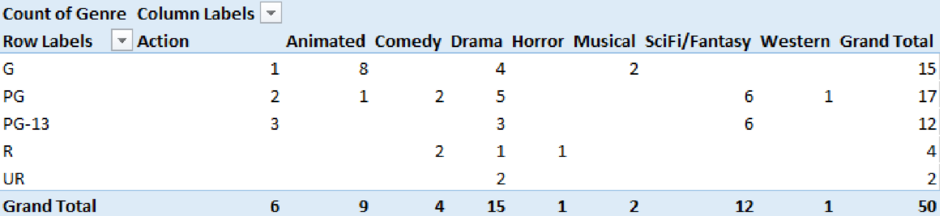
4. The crosstabulation for movie genre and rating for top 50 movies is given below:
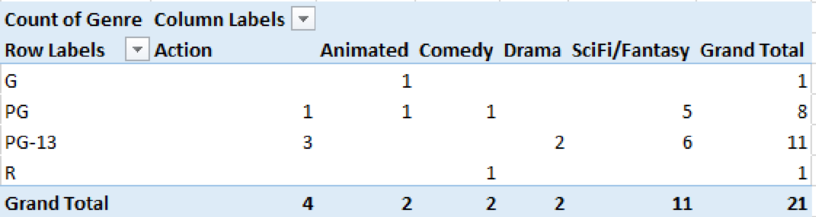
The crosstabulation for movie genre and rating for the movies released after 1980 is as follows:
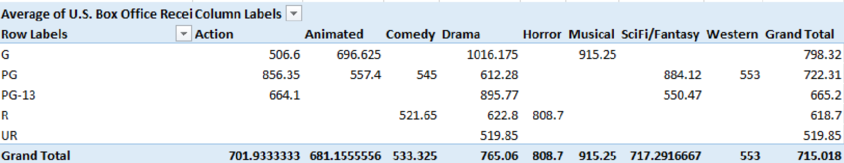
5. The average inflation-adjusted U.S. box-office receipts for genre-rating pair for all movies in the data set is given below:
Explanation of Solution
1.
Step-by-step procedure to obtain the scatter chart of the year released and the inflation-adjusted U.S. box office receipts using an Excel:
- Select the data of Year Released and U.S. Box Office Receipts (Inflation Adjusted Millions $).
- Select Insert.
- Choose Scatter under Charts.
- In Chart Elements, check Trendline.
Thus, the scatter chart of the year released and the inflation-adjusted U.S. box office receipts is obtained.
From the scatter chart, it is clear that there is slight decrease in inflation over years. However, there is no clear linear pattern observed.
2.
Step-by-step procedure to obtain the scatter chart to examine the relationship between the budget and the noninflation-adjusted world box office receipts using an Excel:
- Select the data of Budget (Non-Inflation Adjusted Millions $) and U.S. Box Office Receipts (Non-Inflation Adjusted Millions $).
- Select Insert.
- Choose Scatter under Charts.
- In Chart Elements, check Trendline.
Thus, the scatter chart to examine the relationship between the budget and the noninflation-adjusted world box office receipts is obtained.
From the output, it is clear that as the budget increases, the noninflation-adjusted world box office receipts also increase.
3.
Step-by-step procedure to create frequency distribution and percent frequency distribution for inflation-adjusted U.S. box office receipts using an Excel:
- Select Insert > PivotTable.
- In Select a table or range, select the data of U.S. Box Office Receipts (Inflation Adjusted Millions $) and click OK.
- In PivotTable Fields, move U.S. Box Office Receipts (Inflation Adjusted Millions $) to Rows and Σ Values.
- Right click on a value from Row Labels.
- Enter 100 in By.
- Click on U.S. Box Office Receipts (Inflation Adjusted Millions $) from Σ Values.
- Select Value Field settings.
- In Summarize value field by, choose Count and click OK.
- Again, move U.S. Box Office Receipts (Inflation Adjusted Millions $) to Rows and Σ Values.
- Click on U.S. Box Office Receipts (Inflation Adjusted Millions $) from Σ Values.
- Select Value Field settings.
- In Show Values As, choose % of Grand Total and click OK.
Thus, the frequency distribution and percent frequency distribution are obtained.
Step-by-step procedure to obtain histogram for inflation-adjusted U.S. box office receipts using an Excel:
- Select the data of class interval and percent frequency.
- Select Insert.
- Choose Clustered Column under Charts.
- Click on a bar in the graph.
- In Format Data Series, enter Gap width as 0%.
Thus, the histogram is obtained.
From the distribution table and histogram, it is clear that the frequency for the lowest inflation-adjusted U.S. box office receipts value is the highest. As the value of inflation-adjusted U.S. box office receipts increases, the frequency decreases. The frequency is very low (2%) for the inflation-adjusted U.S. box office receipts value from 1,393 to 1,593.5. This values seem to be outlier.
4.
Step-by-step procedure to obtain crosstabulation for movie genre and rating for top 50 movies using an Excel:
- Select Insert > PivotTable.
- In Select a table or range, select the data of Rating and Genre and click OK.
- In PivotTable Fields, move Rating to Rows, Genre to Columns, and Genre to Σ Values.
- Click on Genre from Σ Values.
- Select Value Field settings.
- In Summarize value field by, choose Count and click OK.
Thus, the crosstabulation for movie genre and rating for top 50 movies is obtained.
From the crosstabulation of movie genre and rating for top 50 movies, it is observed that the combination of G and Animated (=8) is most represented in the top 50 movie data.
Step-by-step procedure to obtain crosstabulation for movie genre and rating for the movies released after 1980 using an Excel:
- Select the data and choose Filter under Sort & Filter.
- Click on the drop-down box in Year Release column.
- Select Number Filters and choose Greater than.
- In Is greater than, enter 1980.
- Select Insert > PivotTable.
- In Select a table or range, select the filtered data of Rating and Genre and click OK.
- In PivotTable Fields, move Rating to Rows, Genre to Columns, and Genre to Σ Values.
- Click on Genre from Σ Values.
- Select Value Field settings.
- In Summarize value field by, choose Count and click OK.
Thus, the crosstabulation for movie genre and rating for the movies released after 1980 is obtained.
From the crosstabulation of movie genre and rating for the movies released after 1980, it is observed that the combination of PG-13 and SciFi/Fantasy (=6) is most represented.
Also, over the time changes, the number of dramas released became reduced. The rating of G and PG becomes high.
5.
Step-by-step procedure to construct the average inflation-adjusted U.S. box-office receipts for genre-rating pair for all movies in the data set using an Excel:
- Select Insert > PivotTable.
- In Select a table or range, select the filtered data of U.S. Box Office Receipts (Inflation Adjusted Millions $), Rating, and Genre and click OK.
- In PivotTable Fields, move Rating to Rows, Genre to Columns, and U.S. Box Office Receipts (Inflation Adjusted Millions $) to Σ Values.
- Click on Genre from Σ Values.
- Select Value Field settings.
- In Summarize value field by, choose Average and click OK.
Thus, the average inflation-adjusted U.S. box-office receipts for genre-rating pair for all movies in the data set is constructed.
From the table, it is clear that the average U.S. box-office receipts are the highest for the genre-rating pair of G and Drama. Also, it is the lowest for G and Action.
Want to see more full solutions like this?
Chapter 3 Solutions
Essentials Of Business Analytics


- Q.2.4 There are twelve (12) teams participating in a pub quiz. What is the probability of correctly predicting the top three teams at the end of the competition, in the correct order? Give your final answer as a fraction in its simplest form.arrow_forwardThe table below indicates the number of years of experience of a sample of employees who work on a particular production line and the corresponding number of units of a good that each employee produced last month. Years of Experience (x) Number of Goods (y) 11 63 5 57 1 48 4 54 5 45 3 51 Q.1.1 By completing the table below and then applying the relevant formulae, determine the line of best fit for this bivariate data set. Do NOT change the units for the variables. X y X2 xy Ex= Ey= EX2 EXY= Q.1.2 Estimate the number of units of the good that would have been produced last month by an employee with 8 years of experience. Q.1.3 Using your calculator, determine the coefficient of correlation for the data set. Interpret your answer. Q.1.4 Compute the coefficient of determination for the data set. Interpret your answer.arrow_forwardCan you answer this question for mearrow_forward
- Techniques QUAT6221 2025 PT B... TM Tabudi Maphoru Activities Assessments Class Progress lIE Library • Help v The table below shows the prices (R) and quantities (kg) of rice, meat and potatoes items bought during 2013 and 2014: 2013 2014 P1Qo PoQo Q1Po P1Q1 Price Ро Quantity Qo Price P1 Quantity Q1 Rice 7 80 6 70 480 560 490 420 Meat 30 50 35 60 1 750 1 500 1 800 2 100 Potatoes 3 100 3 100 300 300 300 300 TOTAL 40 230 44 230 2 530 2 360 2 590 2 820 Instructions: 1 Corall dawn to tha bottom of thir ceraan urina se se tha haca nariad in archerca antarand cubmit Q Search ENG US 口X 2025/05arrow_forwardThe table below indicates the number of years of experience of a sample of employees who work on a particular production line and the corresponding number of units of a good that each employee produced last month. Years of Experience (x) Number of Goods (y) 11 63 5 57 1 48 4 54 45 3 51 Q.1.1 By completing the table below and then applying the relevant formulae, determine the line of best fit for this bivariate data set. Do NOT change the units for the variables. X y X2 xy Ex= Ey= EX2 EXY= Q.1.2 Estimate the number of units of the good that would have been produced last month by an employee with 8 years of experience. Q.1.3 Using your calculator, determine the coefficient of correlation for the data set. Interpret your answer. Q.1.4 Compute the coefficient of determination for the data set. Interpret your answer.arrow_forwardQ.3.2 A sample of consumers was asked to name their favourite fruit. The results regarding the popularity of the different fruits are given in the following table. Type of Fruit Number of Consumers Banana 25 Apple 20 Orange 5 TOTAL 50 Draw a bar chart to graphically illustrate the results given in the table.arrow_forward
- Q.2.3 The probability that a randomly selected employee of Company Z is female is 0.75. The probability that an employee of the same company works in the Production department, given that the employee is female, is 0.25. What is the probability that a randomly selected employee of the company will be female and will work in the Production department? Q.2.4 There are twelve (12) teams participating in a pub quiz. What is the probability of correctly predicting the top three teams at the end of the competition, in the correct order? Give your final answer as a fraction in its simplest form.arrow_forwardQ.2.1 A bag contains 13 red and 9 green marbles. You are asked to select two (2) marbles from the bag. The first marble selected will not be placed back into the bag. Q.2.1.1 Construct a probability tree to indicate the various possible outcomes and their probabilities (as fractions). Q.2.1.2 What is the probability that the two selected marbles will be the same colour? Q.2.2 The following contingency table gives the results of a sample survey of South African male and female respondents with regard to their preferred brand of sports watch: PREFERRED BRAND OF SPORTS WATCH Samsung Apple Garmin TOTAL No. of Females 30 100 40 170 No. of Males 75 125 80 280 TOTAL 105 225 120 450 Q.2.2.1 What is the probability of randomly selecting a respondent from the sample who prefers Garmin? Q.2.2.2 What is the probability of randomly selecting a respondent from the sample who is not female? Q.2.2.3 What is the probability of randomly…arrow_forwardTest the claim that a student's pulse rate is different when taking a quiz than attending a regular class. The mean pulse rate difference is 2.7 with 10 students. Use a significance level of 0.005. Pulse rate difference(Quiz - Lecture) 2 -1 5 -8 1 20 15 -4 9 -12arrow_forward
- The following ordered data list shows the data speeds for cell phones used by a telephone company at an airport: A. Calculate the Measures of Central Tendency from the ungrouped data list. B. Group the data in an appropriate frequency table. C. Calculate the Measures of Central Tendency using the table in point B. D. Are there differences in the measurements obtained in A and C? Why (give at least one justified reason)? I leave the answers to A and B to resolve the remaining two. 0.8 1.4 1.8 1.9 3.2 3.6 4.5 4.5 4.6 6.2 6.5 7.7 7.9 9.9 10.2 10.3 10.9 11.1 11.1 11.6 11.8 12.0 13.1 13.5 13.7 14.1 14.2 14.7 15.0 15.1 15.5 15.8 16.0 17.5 18.2 20.2 21.1 21.5 22.2 22.4 23.1 24.5 25.7 28.5 34.6 38.5 43.0 55.6 71.3 77.8 A. Measures of Central Tendency We are to calculate: Mean, Median, Mode The data (already ordered) is: 0.8, 1.4, 1.8, 1.9, 3.2, 3.6, 4.5, 4.5, 4.6, 6.2, 6.5, 7.7, 7.9, 9.9, 10.2, 10.3, 10.9, 11.1, 11.1, 11.6, 11.8, 12.0, 13.1, 13.5, 13.7, 14.1, 14.2, 14.7, 15.0, 15.1, 15.5,…arrow_forwardPEER REPLY 1: Choose a classmate's Main Post. 1. Indicate a range of values for the independent variable (x) that is reasonable based on the data provided. 2. Explain what the predicted range of dependent values should be based on the range of independent values.arrow_forwardIn a company with 80 employees, 60 earn $10.00 per hour and 20 earn $13.00 per hour. Is this average hourly wage considered representative?arrow_forward
 Glencoe Algebra 1, Student Edition, 9780079039897...AlgebraISBN:9780079039897Author:CarterPublisher:McGraw Hill
 Elementary Geometry for College StudentsGeometryISBN:9781285195698Author:Daniel C. Alexander, Geralyn M. KoeberleinPublisher:Cengage Learning
 Holt Mcdougal Larson Pre-algebra: Student Edition...AlgebraISBN:9780547587776Author:HOLT MCDOUGALPublisher:HOLT MCDOUGAL
 Functions and Change: A Modeling Approach to Coll...AlgebraISBN:9781337111348Author:Bruce Crauder, Benny Evans, Alan NoellPublisher:Cengage Learning