
Intro STATS, Books a la Carte Plus New Mystatlab with Pearson Etext -- Access Card Package
4th Edition
ISBN: 9780321869852
Author: Richard D. De Veaux
Publisher: PEARSON
expand_more
expand_more
format_list_bulleted
Concept explainers
Videos
Textbook Question
Chapter 3, Problem 19E
Heart attack stays The histogram shows the lengths of hospital stays (in days) for all the female patients admitted to hospitals in New York during one year with a primary diagnosis of acute myocardial infarction (heart attack).
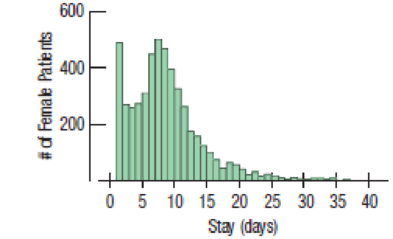
- a) From the histogram, would you expect the
mean ormedian to be higher? Explain. - b) Write a few sentences describing this distribution (shape, center, spread, unusual features).
- c) Which summary statistics would you choose to summarize the center and spread in these data? Why?
Expert Solution & Answer

Trending nowThis is a popular solution!

Students have asked these similar questions
Business Discuss
The following data represent total ventilation measured in liters of air per minute per square meter of body area for two independent (and randomly chosen) samples.
Analyze these data using the appropriate non-parametric hypothesis test
each column represents before & after measurements on the same individual. Analyze with the appropriate non-parametric hypothesis test for a paired design.
Chapter 3 Solutions
Intro STATS, Books a la Carte Plus New Mystatlab with Pearson Etext -- Access Card Package
Ch. 3.2 - Prob. 1JCCh. 3.2 - Prob. 2JCCh. 3.2 - Prob. 3JCCh. 3.2 - Prob. 4JCCh. 3.2 - Prob. 5JCCh. 3.7 - The U.S. Census Bureau reports the median family...Ch. 3.7 - Prob. 7JCCh. 3.7 - Prob. 8JCCh. 3 - Prob. 1ECh. 3 - 2. Opposites In a way, boxplots are the opposite...
Ch. 3 - Prob. 3ECh. 3 - Prob. 4ECh. 3 - Prob. 5ECh. 3 - Prob. 6ECh. 3 - Prob. 7ECh. 3 - Prob. 8ECh. 3 - Thinking about shape Would you expect...Ch. 3 - More shapes Would you expect distributions of...Ch. 3 - Prob. 15ECh. 3 - Prob. 16ECh. 3 - Prob. 17ECh. 3 - Run times One of the authors collected the times...Ch. 3 - Heart attack stays The histogram shows the lengths...Ch. 3 - 20. E-mails A university teacher saved every...Ch. 3 - Prob. 21ECh. 3 - Prob. 22ECh. 3 - Prob. 23ECh. 3 - Prob. 24ECh. 3 - Mistake A clerk entering salary data into a...Ch. 3 - Prob. 26ECh. 3 - Prob. 27ECh. 3 - Prob. 28ECh. 3 - Pizza prices The histogram shows the distribution...Ch. 3 - Neck size The histogram shows the neck sizes (in...Ch. 3 - Pizza prices again Look again at the histogram of...Ch. 3 - Neck sizes again Look again at the histogram of...Ch. 3 - Movie lengths 2010 The histogram shows the running...Ch. 3 - 34. Golf drives 2011 The display shows the average...Ch. 3 - Prob. 35ECh. 3 - Prob. 36ECh. 3 - Prob. 37ECh. 3 - Cold weather A meteorologist preparing a talk...Ch. 3 - Prob. 39ECh. 3 - Prob. 40ECh. 3 - Prob. 41ECh. 3 - The great one During his 20 seasons in the NHL,...Ch. 3 - Prob. 43ECh. 3 - Prob. 44ECh. 3 - Prob. 45ECh. 3 - Prob. 46ECh. 3 - Prob. 47ECh. 3 - Prob. 48ECh. 3 - Prob. 49ECh. 3 - Prob. 50ECh. 3 - Prob. 51ECh. 3 - Prob. 52ECh. 3 - Prob. 53ECh. 3 - Prob. 54ECh. 3 - Prob. 55ECh. 3 - ZIP codes revisited Here are some summary...Ch. 3 - Prob. 57ECh. 3 - Prob. 58ECh. 3 - Prob. 59ECh. 3 - Prob. 60E
Additional Math Textbook Solutions
Find more solutions based on key concepts
For Exercises 13–18, write the negation of the statement.
13. The cell phone is out of juice.
Math in Our World
1. How much money is Joe earning when he’s 30?
Pathways To Math Literacy (looseleaf)
153. A rain gutter is made from sheets of aluminum that are 20 inches wide. As shown in the figure, the edges ...
College Algebra (7th Edition)
(a) Make a stem-and-leaf plot for these 24 observations on the number of customers who used a down-town CitiBan...
APPLIED STAT.IN BUS.+ECONOMICS
Provide an example of a qualitative variable and an example of a quantitative variable.
Elementary Statistics ( 3rd International Edition ) Isbn:9781260092561
Knowledge Booster


Learn more about
Need a deep-dive on the concept behind this application? Look no further. Learn more about this topic, statistics and related others by exploring similar questions and additional content below.Similar questions
- Should you be confident in applying your regression equation to estimate the heart rate of a python at 35°C? Why or why not?arrow_forwardGiven your fitted regression line, what would be the residual for snake #5 (10 C)?arrow_forwardCalculate the 95% confidence interval around your estimate of r using Fisher’s z-transformation. In your final answer, make sure to back-transform to the original units.arrow_forward
- BUSINESS DISCUSSarrow_forwardA researcher wishes to estimate, with 90% confidence, the population proportion of adults who support labeling legislation for genetically modified organisms (GMOs). Her estimate must be accurate within 4% of the true proportion. (a) No preliminary estimate is available. Find the minimum sample size needed. (b) Find the minimum sample size needed, using a prior study that found that 65% of the respondents said they support labeling legislation for GMOs. (c) Compare the results from parts (a) and (b). ... (a) What is the minimum sample size needed assuming that no prior information is available? n = (Round up to the nearest whole number as needed.)arrow_forwardThe table available below shows the costs per mile (in cents) for a sample of automobiles. At a = 0.05, can you conclude that at least one mean cost per mile is different from the others? Click on the icon to view the data table. Let Hss, HMS, HLS, Hsuv and Hмy represent the mean costs per mile for small sedans, medium sedans, large sedans, SUV 4WDs, and minivans respectively. What are the hypotheses for this test? OA. Ho: Not all the means are equal. Ha Hss HMS HLS HSUV HMV B. Ho Hss HMS HLS HSUV = μMV Ha: Hss *HMS *HLS*HSUV * HMV C. Ho Hss HMS HLS HSUV =μMV = = H: Not all the means are equal. D. Ho Hss HMS HLS HSUV HMV Ha Hss HMS HLS =HSUV = HMVarrow_forward
arrow_back_ios
SEE MORE QUESTIONS
arrow_forward_ios
Recommended textbooks for you
 Big Ideas Math A Bridge To Success Algebra 1: Stu...AlgebraISBN:9781680331141Author:HOUGHTON MIFFLIN HARCOURTPublisher:Houghton Mifflin Harcourt
 Glencoe Algebra 1, Student Edition, 9780079039897...AlgebraISBN:9780079039897Author:CarterPublisher:McGraw Hill
 Holt Mcdougal Larson Pre-algebra: Student Edition...AlgebraISBN:9780547587776Author:HOLT MCDOUGALPublisher:HOLT MCDOUGAL
Big Ideas Math A Bridge To Success Algebra 1: Stu...
Algebra
ISBN:9781680331141
Author:HOUGHTON MIFFLIN HARCOURT
Publisher:Houghton Mifflin Harcourt
Glencoe Algebra 1, Student Edition, 9780079039897...
Algebra
ISBN:9780079039897
Author:Carter
Publisher:McGraw Hill
Holt Mcdougal Larson Pre-algebra: Student Edition...
Algebra
ISBN:9780547587776
Author:HOLT MCDOUGAL
Publisher:HOLT MCDOUGAL
The Shape of Data: Distributions: Crash Course Statistics #7; Author: CrashCourse;https://www.youtube.com/watch?v=bPFNxD3Yg6U;License: Standard YouTube License, CC-BY
Shape, Center, and Spread - Module 20.2 (Part 1); Author: Mrmathblog;https://www.youtube.com/watch?v=COaid7O_Gag;License: Standard YouTube License, CC-BY
Shape, Center and Spread; Author: Emily Murdock;https://www.youtube.com/watch?v=_YyW0DSCzpM;License: Standard Youtube License