
Concept explainers
Videos
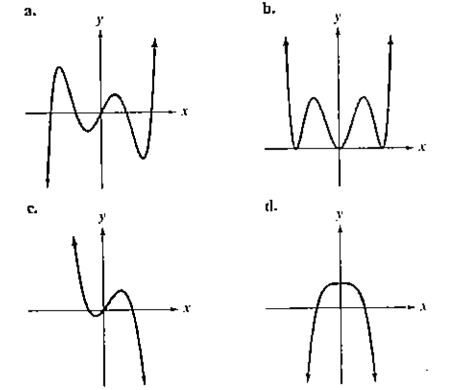
In Exercises 10-13, use the Leading Coefficient Test to determine the end behavior of the graph of the given polynomial function. Then use this end behavior to match the polynomial function with its graph. [ The graphs are labeled (a) through (d).
Want to see the full answer?
Check out a sample textbook solution
Chapter 3 Solutions
EBK ALGEBRA AND TRIGONOMETRY
Additional Math Textbook Solutions
Math in Our World
Elementary Statistics: A Step By Step Approach
Elementary Statistics: Picturing the World (7th Edition)
Finite Mathematics for Business, Economics, Life Sciences and Social Sciences
Mathematics for the Trades: A Guided Approach (11th Edition) (What's New in Trade Math)
A First Course in Probability (10th Edition)


- There are 25 different varieties of flowering plants found in a natural habitat you are studying. You are asked to randomly select 5 of these flowering plant varieties to bring back to your laboratory for further study. How many different combinations of are possible? That is, how many possible 5 plant subgroups can be formed out of the 25 total plants found?arrow_forwardA person is tossing a fair, two-sided coin three times and recording the results (either a Heads, H, or a Tails, T). Let E be the event that exactly two heads are tossed. Which of the following sets represent the event E? Group of answer choices {HHT, HTH, THH} {HHT, THH} {HHH, HHT, HTH, THH, TTT, TTH, THT, HTT} {HH}arrow_forwardTake Quiz 54m Exit Let the universal set be whole numbers 1 through 20 inclusive. That is, U = {1, 2, 3, 4, . . ., 19, 20}. Let A, B, and C be subsets of U. Let A be the set of all prime numbers: A = {2, 3, 5, 7, 11, 13, 17, 19} Let B be the set of all odd numbers: B = {1,3,5,7, • • , 17, 19} Let C be the set of all square numbers: C = {1,4,9,16} ☐ Question 2 3 pts Which of the following statement(s) is true? Select all that apply. (1) АСВ (2) A and C are disjoint (mutually exclusive) sets. (3) |B| = n(B) = 10 (4) All of the elements in AC are even numbers. ☐ Statement 1 is true. Statement 2 is true. Statement 3 is true. Statement 4 is true.arrow_forward
- ☐ Question 1 2 pts Let G be the set that represents all whole numbers between 5 and 12 exclusive. Which of the following is set G in standard set notation. (Roster Method)? O G = [5, 12] G = {5, 6, 7, 8, 9, 10, 11, 12} O G = (5, 12) OG = {6, 7, 8, 9, 10, 11}arrow_forwardSolve thisarrow_forwardint/PlayerHomework.aspx?homeworkId=689099898&questionId=1&flushed=false&cid=8120746¢erw BP Physical Geograph... HW Score: 0%, 0 of 13 points ○ Points: 0 of 1 Determine if the values of the variables listed are solutions of the system of equations. 2x - y = 4 3x+5y= - 6 x=1, y = 2; (1,-2) Is (1, 2) a solution of the system of equations? L No Yes iew an example Get more help - Aarrow_forward
- 12:01 PM Tue May 13 < AA ✓ Educatic S s3.amazona... A Assess Your... 目 accelerate-iu15-bssd.vschool.com S s3.amazona... Trigonometric Identities Module Exam Dashboard ... Dashboard ... Algebra 2 Pa... Algebra 2 Part 4 [Honors] (Acc. Ed.) (Zimmerman) 24-25 / Module 11: Trigonometric Identities i + 38% ✰ Start Page Alexis Forsythe All changes saved 10. A sound wave's amplitude can be modeled by the function y = −7 sin ((x-1) + 4). Within the interval 0 < x < 12, when does the function have an amplitude of 4? (Select all that apply.) 9.522 seconds 4.199 seconds 0.522 seconds 1.199 seconds Previous 10 of 20 Nextarrow_forwardJamal wants to save $48,000 for a down payment on a home. How much will he need to invest in an account with 11.8% APR, compounding daily, in order to reach his goal in 10 years? Round to the nearest dollar.arrow_forwardr nt Use the compound interest formula, A (t) = P(1 + 1)". An account is opened with an intial deposit of $7,500 and earns 3.8% interest compounded semi- annually. Round all answers to the nearest dollar. a. What will the account be worth in 10 years? $ b. What if the interest were compounding monthly? $ c. What if the interest were compounded daily (assume 365 days in a year)? $arrow_forward
- Kyoko has $10,000 that she wants to invest. Her bank has several accounts to choose from. Her goal is to have $15,000 by the time she finishes graduate school in 7 years. To the nearest hundredth of a percent, what should her minimum annual interest rate be in order to reach her goal assuming they compound daily? (Hint: solve the compound interest formula for the intrerest rate. Also, assume there are 365 days in a year) %arrow_forward3:56 wust.instructure.com Page 0 Chapter 5 Test Form A of 2 - ZOOM + | Find any real numbers for which each expression is undefined. 2x 4 1. x Name: Date: 1. 3.x-5 2. 2. x²+x-12 4x-24 3. Evaluate when x=-3. 3. x Simplify each rational expression. x²-3x 4. 2x-6 5. x²+3x-18 x²-9 6. Write an equivalent rational expression with the given denominator. 2x-3 x²+2x+1(x+1)(x+2) Perform the indicated operation and simplify if possible. x²-16 x-3 7. 3x-9 x²+2x-8 x²+9x+20 5x+25 8. 4.x 2x² 9. x-5 x-5 3 5 10. 4x-3 8x-6 2 3 11. x-4 x+4 x 12. x-2x-8 x²-4 ← -> Copyright ©2020 Pearson Education, Inc. + 5 4. 5. 6. 7. 8. 9. 10. 11. 12. T-97arrow_forwardProblem #5 Suppose you flip a two sided fair coin ("heads" or "tails") 8 total times. a). How many ways result in 6 tails and 2 heads? b). How many ways result in 2 tails and 6 heads? c). Compare your answers to part (a) and (b) and explain in a few sentences why the comparison makes sense.arrow_forward
 College Algebra (MindTap Course List)AlgebraISBN:9781305652231Author:R. David Gustafson, Jeff HughesPublisher:Cengage Learning
 Trigonometry (MindTap Course List)TrigonometryISBN:9781337278461Author:Ron LarsonPublisher:Cengage Learning

 College AlgebraAlgebraISBN:9781305115545Author:James Stewart, Lothar Redlin, Saleem WatsonPublisher:Cengage Learning
 Big Ideas Math A Bridge To Success Algebra 1: Stu...AlgebraISBN:9781680331141Author:HOUGHTON MIFFLIN HARCOURTPublisher:Houghton Mifflin Harcourt