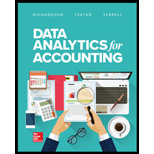
Data Analytics For Accounting
19th Edition
ISBN: 9781260375190
Author: RICHARDSON, Vernon J., Teeter, Ryan, Terrell, Katie
Publisher: Mcgraw-hill Education,
expand_more
expand_more
format_list_bulleted
Concept explainers
Textbook Question
Chapter 3, Problem 11DQ
Exhibits 3-1, 3-2, 3-3, and 3-4 suggest that volume and distance are the best predictors of “days to ship” for a Wholesale company. Any other variables that would also be useful in predicting the number of “days to ship”?
Expert Solution & Answer
Want to see the full answer?
Check out a sample textbook solutionStudents have asked these similar questions
Sales data would be considered to be examples of __________ data.
Multiple Choice
ordinal
interval
ratio
unstructured
9.
In a Balanced Scorecard, what perspective would a measure of
the number of repeat orders be most likely to appear?
(a) Market perspective
(b) Customer perspective
(c) Internal perspective
(d) Financial perspective
In forecasting the sales for the year, which is not included in making assumptions?
Select the correct response:
market share
advertising and product promotion
general economic condition
availability of elerical staff for credit and collections
Chapter 3 Solutions
Data Analytics For Accounting
Ch. 3 - Prob. 1MCQCh. 3 - Prob. 2MCQCh. 3 - Prob. 3MCQCh. 3 - Prob. 4MCQCh. 3 - In general, the more complex the model, the...Ch. 3 - In general, the simpler the model, the greater the...Ch. 3 - _____ is a discriminating classifier that is...Ch. 3 - Prob. 8MCQCh. 3 - Models associated with regression and...Ch. 3 - Prob. 10MCQ
Ch. 3 - What is the difference between a target and a...Ch. 3 - What is the difference between a supervised and an...Ch. 3 - Prob. 3DQCh. 3 - Prob. 4DQCh. 3 - Prob. 5DQCh. 3 - Prob. 6DQCh. 3 - How might classification be used in approving or...Ch. 3 - Prob. 8DQCh. 3 - How does fuzzy match work? Give an accounting...Ch. 3 - Compare and contrast the profiling data approach...Ch. 3 - Exhibits 3-1, 3-2, 3-3, and 3-4 suggest that...Ch. 3 - Prob. 1PCh. 3 - Prob. 2PCh. 3 - An auditor is trying to figure out if the goodwill...Ch. 3 - How might clustering be used to explain customers...Ch. 3 - Why would the use of data reduction be useful to...Ch. 3 - How could an investor use XBRL to do an analysis...Ch. 3 - Prob. 7P
Knowledge Booster
Learn more about
Need a deep-dive on the concept behind this application? Look no further. Learn more about this topic, accounting and related others by exploring similar questions and additional content below.Similar questions
- Use the following information to answer the questions that follow. A. Calculate the operating income percentage for each of the stores. Comment on how your analysis has changed for each store. B. Perform a vertical analysis for each store. Based on your analysis, what accounts would you want to investigate further? How might management utilize this information? C. Which method of analysis (using a dollar value or percentage) is most relevant and/or useful? Explain.arrow_forwardConsider again the example introduced in Section 7.5 of a credit card company that has a database of information provided by its customers when they apply for credit cards. An analyst has created a multiple regression model for which the dependent variable in the model is credit card charges accrued by a customer in the data set over the past year (y), and the independent variables are the customers annual household income (x1), number of members of the household (x2), and number of years of post-high school education (x3). Figure 7.23 provides Excel output for a multiple regression model estimated using a data set the company created. a. Estimate the corresponding simple linear regression with the customers annual household income as the independent variable and credit card charges accrued by a customer over the past year as the dependent variable. Interpret the estimated relationship between the customers annual household income and credit card charges accrued over the past year. How much variation in credit card charges accrued by a customer over the past year is explained by this simple linear regression model? b. Estimate the corresponding simple linear regression with the number of members in the customers household as the independent variable and credit card charges accrued by a customer over the past year as the dependent variable. Interpret the estimated relationship between the number of members in the customers household and credit card charges accrued over the past year. How much variation in credit card charges accrued by a customer over the past year is explained by this simple linear regression model? c. Estimate the corresponding simple linear regression with the customers number of years of posthigh school education as the independent variable and credit card charges accrued by a customer over the past year as the dependent variable. Interpret the estimated relationship between the customers number of years of posthigh school education and credit card charges accrued over the past year. How much variation in credit card charges accrued by a customer over the past year is explained by this simple linear regression model? d. Recall the multiple regression in Figure 7.23 with credit card charges accrued by a customer over the past year as the dependent variable and customers annual household income (x1), number of members of the household (x2), and number of years of post-high school education (x3) as the independent variables. Do the estimated slopes differ substantially from the corresponding slopes that were estimated using simple linear regression in parts (a), (b), and (c)? What does this tell you about multicollinearity in the multiple regression model in Figure 7.23? e. Add the coefficients of determination for the simple linear regression in parts (a), (b), and (c), and compare the result to the coefficient of determination for the multiple regression model in Figure 7.23. What does this tell you about multicollinearity in the multiple regression model in Figure 7.23? f. Add age, a dummy variable for sex, and a dummy variable for whether a customer has exceeded his or her credit limit in the past 12 months as independent variables to the multiple regression model in Figure 7.23. Code the dummy variable for sex as 1 if the customer is female and 0 if male, and code the dummy variable for whether a customer has exceeded his or her credit limit in the past 12 months as 1 if the customer has exceeded his or her credit limit in the past 12 months and 0 otherwise. Do these variables substantially improve the fit of your model?arrow_forwardThe Performance Measure of number of on-time deliveries would be used as a measure in which of the following Balanced Scorecard Perspectives? A) Financial Perspective B) Customer Perspective C) Internal-Business-Process Perspective D) Innovation/Learning & Growth Perspectivearrow_forward
- On-time arrivals, lost baggage, and customer complaints are three measures that are typically used to measure the quality of service being offered by airlines. Suppose that the following values represent the on-time arrival percentage, amount of lost baggage, and customer complaints for 10 U.S. airlines. a. Based on the data above, if you randomly choose a Delta Air Lines flight, what is the probability that this individual flight will have an on-time arrival? b. If you randomly choose 1 of the 10 airlines for a follow-up study on airline quality ratings, what is the probability that you will choose an airline with less than two mishandled baggage reports per 1,000 passengers? c. If you randomly choose 1 of the 10 airlines for a follow-up study on airline quality ratings, what is the probability that you will choose an airline with more than one customer complaint per 1,000 passengers? d. What is the probability that a randomly selected AirTran Airways flight will not arrive on time?arrow_forwardYou can use Excel functions to find the answers for the following question (round off the values to 4 decimal places): a. Supplier on-time delivery performance is critical to enabling the buyer’s organization to meet its customer service commitments. Therefore, monitoring supplier delivery times is critical. Based on a great deal of historical data, a manufacturer of personal computers finds for one of its just-in-time suppliers that the delivery times are random and well approximated by the Normal distribution with mean 51.7 minutes and standard deviation 9.5 minutes.arrow_forwardHow do you conduct a SWOT analysis for Walmart?arrow_forward
- Ohio Logistics manages the logistical activities for firms by matching companies that need products shipped with carriers that can provide the best rates and best service for the companies. Ohio Logistics is very concerned that its carriers deliver their customers material on time, so it carefully monitors the percentage of on-time deliveries. The following table contains a list of the carriers used by Ohio Logistics and the corresponding on-time percentages for the current and previous years. a. Sort the carriers in descending order by their current years percentage of on-time deliveries. Which carrier is providing the best service in the current year? Which carrier is providing the worst service in the current year? b. Calculate the change in percentage of on-time deliveries from the previous to the current year for each carrier. Use Excels conditional formatting to highlight the carriers whose on-time percentage decreased from the previous year to the current year. c. Use Excels conditional formatting tool to create data bars for the change in percentage of on-time deliveries from the previous year to the current year for each carrier calculated in part b. d. Which carriers should Ohio Logistics try to use in the future? Why?arrow_forwardThe order size associated with the economic-order-quantity (EOQ) model will necessarily decline if:a. Ordering costs riseb. Storage costs risec. Insurance costs for materials in storage falld. Stockout costs risearrow_forwardPrice accuracy and right product offering are important aspect of an efficient order-to-cash (OTC). How can it be achieved with a properly managed OTC? What are your suggestions? Why? (Explain in min. 3-4 sentences.)arrow_forward
- Please develop a spreadsheet to investigate the sensitivity of annual profit (loss) to changes in the occupancy rate and the annual rental rate.arrow_forwardWhich of the following types of analysis is particularly useful for trend analysis? a. vertical analysis c. trend-setting analysis b. horizontal analysis d. timetable analysisarrow_forwardConsider the following time series data: Construct a time series plot. What type of pattern exists in the data? Use a multiple regression model with dummy variables as follows to develop an equation to account for seasonal effects in the data: Qtr1 = 1 if quarter 1, 0 otherwise; Qtr2 = 1 if quarter 2. 0 otherwise; Qtr3 = 1 if quarter 3, 0 otherwise. Compute the quarterly forecasts for next year based on the model you developed in part (b). Use a multiple regression model to develop an equation to account for trend and seasonal effects in the data. Use the dummy variables you developed in part (b) to capture seasonal effects and create a variable t such that t = 1 for quarter 1 in year 1, t = 2 for quarter 2 in year 1, … t = 12 for quarter 4 in year 3. Compute the quarterly forecasts for next year based on the model you developed in part (d). Is the model you developed in part (b) or the model you developed in part (d) more effective? Justify your answer.arrow_forward
arrow_back_ios
SEE MORE QUESTIONS
arrow_forward_ios
Recommended textbooks for you
- Essentials of Business Analytics (MindTap Course ...StatisticsISBN:9781305627734Author:Jeffrey D. Camm, James J. Cochran, Michael J. Fry, Jeffrey W. Ohlmann, David R. AndersonPublisher:Cengage LearningPrinciples of Accounting Volume 2AccountingISBN:9781947172609Author:OpenStaxPublisher:OpenStax College
- Cornerstones of Financial AccountingAccountingISBN:9781337690881Author:Jay Rich, Jeff JonesPublisher:Cengage LearningAccounting Information SystemsAccountingISBN:9781337619202Author:Hall, James A.Publisher:Cengage Learning,Managerial Accounting: The Cornerstone of Busines...AccountingISBN:9781337115773Author:Maryanne M. Mowen, Don R. Hansen, Dan L. HeitgerPublisher:Cengage Learning
Essentials of Business Analytics (MindTap Course ...
Statistics
ISBN:9781305627734
Author:Jeffrey D. Camm, James J. Cochran, Michael J. Fry, Jeffrey W. Ohlmann, David R. Anderson
Publisher:Cengage Learning
Principles of Accounting Volume 2
Accounting
ISBN:9781947172609
Author:OpenStax
Publisher:OpenStax College
Cornerstones of Financial Accounting
Accounting
ISBN:9781337690881
Author:Jay Rich, Jeff Jones
Publisher:Cengage Learning
Accounting Information Systems
Accounting
ISBN:9781337619202
Author:Hall, James A.
Publisher:Cengage Learning,
Managerial Accounting: The Cornerstone of Busines...
Accounting
ISBN:9781337115773
Author:Maryanne M. Mowen, Don R. Hansen, Dan L. Heitger
Publisher:Cengage Learning
The management of receivables Introduction - ACCA Financial Management (FM); Author: OpenTuition;https://www.youtube.com/watch?v=tLmePnbC3ZQ;License: Standard YouTube License, CC-BY