
Concept explainers
Videos
1.
Introduction:
Variable costs and Fixed costs:
Variable costs are those that increase or decrease with the general volume of work. Some of the examples of variable costs are sales commissions, labor costs, raw material costs, etc. Fixed costs are those costs that remain fixed irrespective of the volume of work. Some of the examples of fixed costs are office rent, administrative expenses,
Least square regression method:
The least-square regression method uses the regression line to classify the total cost into variable and fixed cost and thus minimizing the sum of squares of the errors and hence we can get the best line of fit with minimum variances. The least-square regression can be expressed as Y = a + bx
Where Y is Total cost
A is the total fixed cost
B is the variable cost
X is the activity level
To prepare: a scatter plot graph.
1.
Answer to Problem 2A.2E
This is the scatterplot graph for the B rental car.
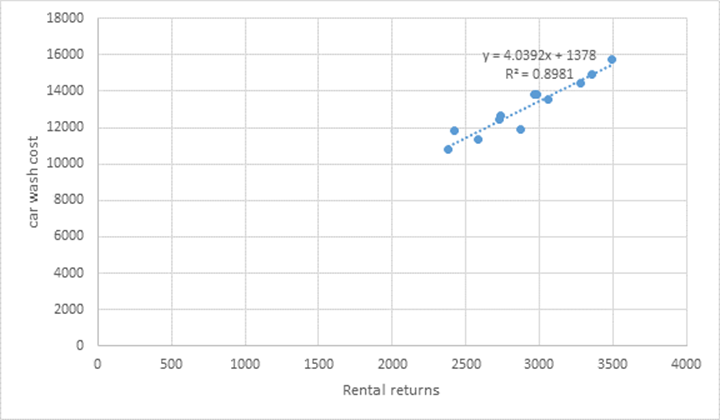
Explanation of Solution
According to the given information the rental returns and car wash costs of B rental cars have been given and we have to prepare a scatter graph plot where the car wash cost should be on the vertical axis and the rental returns on the horizontal axis. To prepare the scatter graph first we have to go to insert option and select scatter graph from charts. The next step is to enter the X values and Y values and then we will get the graph. Now we can add trend line and axis title by clicking on the + symbol next to the graph. After adding the trend line we can click on the arrow button next to the trend line and select more options and then in that we have to checkmark display equation and display R squared value on the chart. The following is the data for plotting the graph:
| Rental returns | Car wash costs ($) |
| 2380 | 10825 |
| 2421 | 11865 |
| 2586 | 11332 |
| 2725 | 12422 |
| 2968 | 13850 |
| 3281 | 14419 |
| 3353 | 14935 |
| 3489 | 15738 |
| 3057 | 13563 |
| 2876 | 11889 |
| 2735 | 12683 |
| 2983 | 13796 |
2.
Introduction:
Variable costs are those that increase or decrease with the general volume of work. Some of the examples of variable costs are sales commissions, labor costs, raw material costs, etc. Fixed costs are those costs that remain fixed irrespective of the volume of work. Some of the examples of fixed costs are office rent, administrative expenses, depreciation, etc.
Least square regression method:
The least-square regression method uses the regression line to classify the total cost into variable and fixed cost and thus minimizing the sum of squares of the errors and hence we can get the best line of fit with minimum variances. The least-square regression can be expressed as Y = a + bx
Where Y is Total cost
A is the total fixed cost
B is the variable cost
X is the activity level
To calculate: the variable cost per rental return and the monthly fixed washing cars using least square regression method.
2.
Answer to Problem 2A.2E
Thus, the variable cost per unit is $4.04 and the fixed cost per unit is $145583 for Bargain rental car.
Explanation of Solution
To calculate the variable cost per rental return and the monthly fixed washing cars using the least square regression method first we have to calculate the X, Y, X2 and XY. In the given data the rental return is taken as X and car wash costs is taken as Y, let us now calculate the X2 and XY:
| Months | X | Y | X2 | XY |
| January | 2380 | 10825 | 5664400 | 25763500 |
| February | 2421 | 11865 | 5861241 | 28725165 |
| March | 2586 | 11332 | 6687396 | 29304552 |
| April | 2725 | 12422 | 7425625 | 33849950 |
| May | 2968 | 13850 | 8809024 | 41106800 |
| June | 3281 | 14419 | 10764961 | 47308739 |
| July | 3353 | 14935 | 11242609 | 50077055 |
| August | 3489 | 15738 | 12173121 | 54909882 |
| September | 3057 | 13563 | 9345249 | 41462091 |
| October | 2876 | 11889 | 8271376 | 34192764 |
| November | 2735 | 12683 | 7480225 | 34688005 |
| December | 2983 | 13796 | 8898289 | 41153468 |
| Total | 34854 | 157317 | 102623516 | 462541971 |
Now let us calculate the variable cost using following formula:
Variable cost per unit
Now, let us calculate the fixed cost per unit using following formula:
Fixed cost per unit
Want to see more full solutions like this?
Chapter 2A Solutions
MANAGERIAL ACCOUNTING CONNECT ACCESS <C>


- I need assistance with this financial accounting problem using appropriate calculation techniques.arrow_forwardLoomTex Industries budgets total factory overhead for the year at $960,000. LoomTex manufactures two curtain products: blackout curtains and thermal curtains. These products each require 4 direct labor hours to manufacture. Each product is budgeted for 8,000 units of production for the year. Determine the factory overhead allocated per unit for thermal curtains using the single plant wide factory overhead rate.arrow_forwardCalculate Harington's cost of goods sold for 2013.arrow_forward
- Braylon Manufacturing has beginning work in process inventory of $125,000 and total manufacturing costs of $740,000. If the cost of goods manufactured is $710,000, what is the cost of the ending work in process inventory?arrow_forwardTaxpayer has a warehouse where she acquired equipment for $24,000. Over time, depreciation of $15,000 was claimed. In the current year, taxpayer sells the asset for $28,000. What is the amount and nature of the gain/loss from the sale? A. $15,000 of ordinary income, $4,000 long term capital gain B. $19,000 longterm capital gain C. $4,000 of long-term capital gain, 12,000 of ordinary income D. $19,000 ordinary incomearrow_forwardEstefan, Inc. produces a product that has a variable cost of $8.00 per unit. The company's fixed costs are $75,000. The product is sold for $12.50 per unit and the company desires to earn a target profit of $45,000. What is the amount of sales that will be necessary to earn the desired profit?arrow_forward
- How does operational efficiency measurement differ from financial metrics? a) Process effectiveness indicators complement cost measures b) Financial data tells complete story c) Efficiency remains constant d) Standard metrics work everywherearrow_forwardSummit Gear Co. estimates its manufacturing overhead to be $620,000 and its direct labor costs to be $1,000,000 for year 1. The first three jobs that Summit Gear worked on had actual direct labor costs of $31,000 for Job 401, $42,000 for Job 402, and $53,000 for Job 403. For the year, actual manufacturing overhead was $600,000 and total direct labor cost was $970,000. Manufacturing overhead is applied to jobs on the basis of direct labor costs using predetermined rates. How much overhead was assigned to each of the three jobs, 401, 402, and 403?arrow_forwardWhat amount of gain does he have to report on this sale?arrow_forward
 Pkg Acc Infor Systems MS VISIO CDFinanceISBN:9781133935940Author:Ulric J. GelinasPublisher:CENGAGE L
 Managerial Accounting: The Cornerstone of Busines...AccountingISBN:9781337115773Author:Maryanne M. Mowen, Don R. Hansen, Dan L. HeitgerPublisher:Cengage Learning