Concept explainers
Videos
Want to see the full answer?
Check out a sample textbook solution
Chapter 28 Solutions
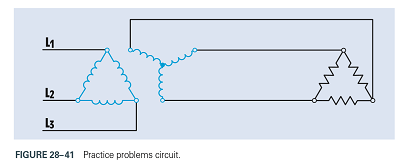
Delmar's Standard Textbook Of Electricity


- Please solve question c,d,e step by step and handwritten and do not use chat gpt or ai tools thank you very much!arrow_forwardQ1: Design a logic circuit for the finite-state machine described by the assigned table in Fig. 1: Using D flip-flops. a. b. Using T flip-flops. Present Next State Output State x=0 x=0 YE Y₁Y Y₁Y Z 00 00 01 0 0 от 00 0 0 10 00 10 11 00 10 0arrow_forwardFind Va and Vb using mesh analysisarrow_forward
- Q4: Write VHDL code to implement the finite-state machine described by the state Diagram in Fig. 1. Fig. 1arrow_forward1. Consider the following feedback system. Bode plot of G(s) is shown below. Phase (deg) Magnitude (dB) -50 -100 -150 -200 0 -90 -180 -270 101 System: sys Frequency (rad/s): 0.117 Magnitude (dB): -74 10° K G(s) Bode Diagram System: sys Frequency (rad/s): 36.8 Magnitude (dB): -99.7 System: sys Frequency (rad/s): 20 Magnitude (dB): -89.9 System: sys Frequency (rad/s): 20 Phase (deg): -143 System: sys Frequency (rad/s): 36.8 Phase (deg): -180 101 Frequency (rad/s) a) Determine the range of K for which the closed-loop system is stable. 102 10³ b) If we want the gain margin to be exactly 50 dB, what is value for K we should choose? c) If we want the phase margin to be exactly 37°, what is value of K we should choose? What will be the corresponding rise time (T) for step-input? d) If we want steady-state error of step input to be 0.6, what is value of K we should choose?arrow_forward: Write VHDL code to implement the finite-state machine/described by the state Diagram in Fig. 4. X=1 X=0 solo X=1 X=0 $1/1 X=0 X=1 X=1 52/2 $3/3 X=1 Fig. 4 X=1 X=1 56/6 $5/5 X=1 54/4 X=0 X-O X=O 5=0 57/7arrow_forward
- Questions: Q1: Verify that the average power generated equals the average power absorbed using the simulated values in Table 7-2. Q2: Verify that the reactive power generated equals the reactive power absorbed using the simulated values in Table 7-2. Q3: Why it is important to correct the power factor of a load? Q4: Find the ideal value of the capacitor theoretically that will result in unity power factor. Vs pp (V) VRIPP (V) VRLC PP (V) AT (μs) T (us) 8° pf Simulated 14 8.523 7.84 84.850 1000 29.88 0.866 Measured 14 8.523 7.854 82.94 1000 29.85 0.86733 Table 7-2 Power Calculations Pvs (mW) Qvs (mVAR) PRI (MW) Pay (mW) Qt (mVAR) Qc (mYAR) Simulated -12.93 -7.428 9.081 3.855 12.27 -4.84 Calculated -12.936 -7.434 9.083 3.856 12.32 -4.85 Part II: Power Factor Correction Table 7-3 Power Factor Correction AT (us) 0° pf Simulated 0 0 1 Measured 0 0 1arrow_forwardQuestions: Q1: Verify that the average power generated equals the average power absorbed using the simulated values in Table 7-2. Q2: Verify that the reactive power generated equals the reactive power absorbed using the simulated values in Table 7-2. Q3: Why it is important to correct the power factor of a load? Q4: Find the ideal value of the capacitor theoretically that will result in unity power factor. Vs pp (V) VRIPP (V) VRLC PP (V) AT (μs) T (us) 8° pf Simulated 14 8.523 7.84 84.850 1000 29.88 0.866 Measured 14 8.523 7.854 82.94 1000 29.85 0.86733 Table 7-2 Power Calculations Pvs (mW) Qvs (mVAR) PRI (MW) Pay (mW) Qt (mVAR) Qc (mYAR) Simulated -12.93 -7.428 9.081 3.855 12.27 -4.84 Calculated -12.936 -7.434 9.083 3.856 12.32 -4.85 Part II: Power Factor Correction Table 7-3 Power Factor Correction AT (us) 0° pf Simulated 0 0 1 Measured 0 0 1arrow_forwardelectric plants. Prepare the load schedulearrow_forward
 Power System Analysis and Design (MindTap Course ...Electrical EngineeringISBN:9781305632134Author:J. Duncan Glover, Thomas Overbye, Mulukutla S. SarmaPublisher:Cengage Learning
 Electricity for Refrigeration, Heating, and Air C...Mechanical EngineeringISBN:9781337399128Author:Russell E. SmithPublisher:Cengage Learning