
(a):
(a):
Explanation of Solution
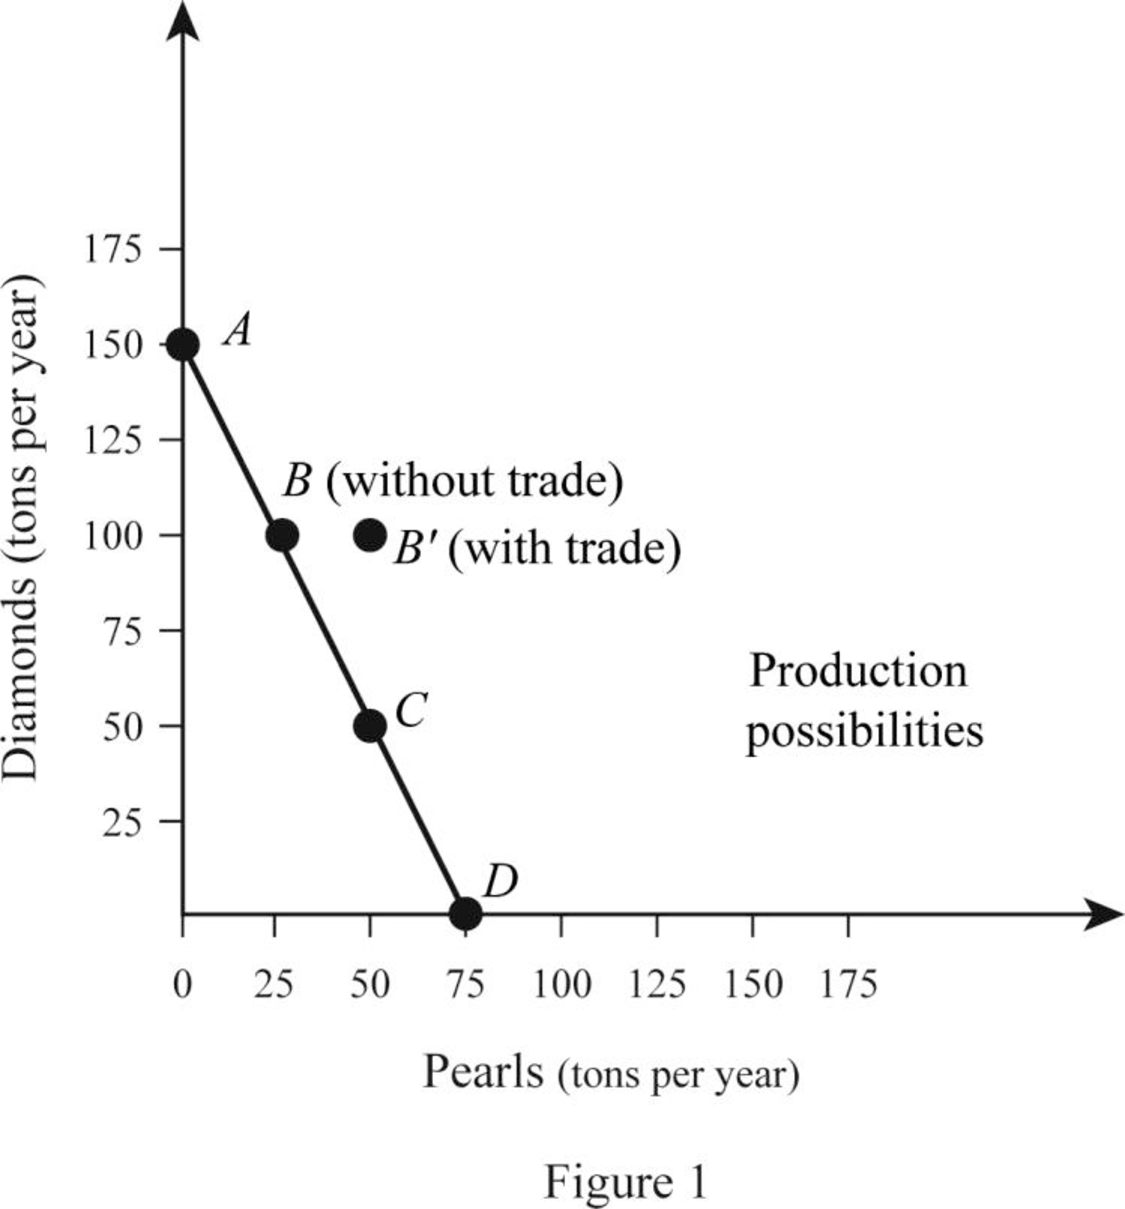
The opportunity cost of producing a commodity can be calculated by dividing the total quantity of Pearls lost with the Diamonds gained for the country. Country A produces either 150 tons of Diamonds or 75 ton of Pearls. Thus, the opportunity cost can be calculated as follows:
Therefore, the opportunity cost of producing a ton of Diamond is
Thus, the opportunity cost of producing a ton of Diamond for Country B is equal to 2 tons of Pearls.
Opportunity cost: Opportunity cost is the cost of the next best alternatives that is foregone while making the choices. When the resources are used for the production of Commodity A, Commodity B that could be made with that same quantity of resource will be the opportunity cost.
(b):
Opportunity cost of producing Pearls.
(b):
Explanation of Solution
The opportunity cost of producing Pearl can be calculated by dividing the total quantity of Diamonds lost with the Pearls gained for the country. Country A produces either 150 tons of Diamonds or 75 ton of Pearl. Thus, the opportunity cost can be calculated as follows:
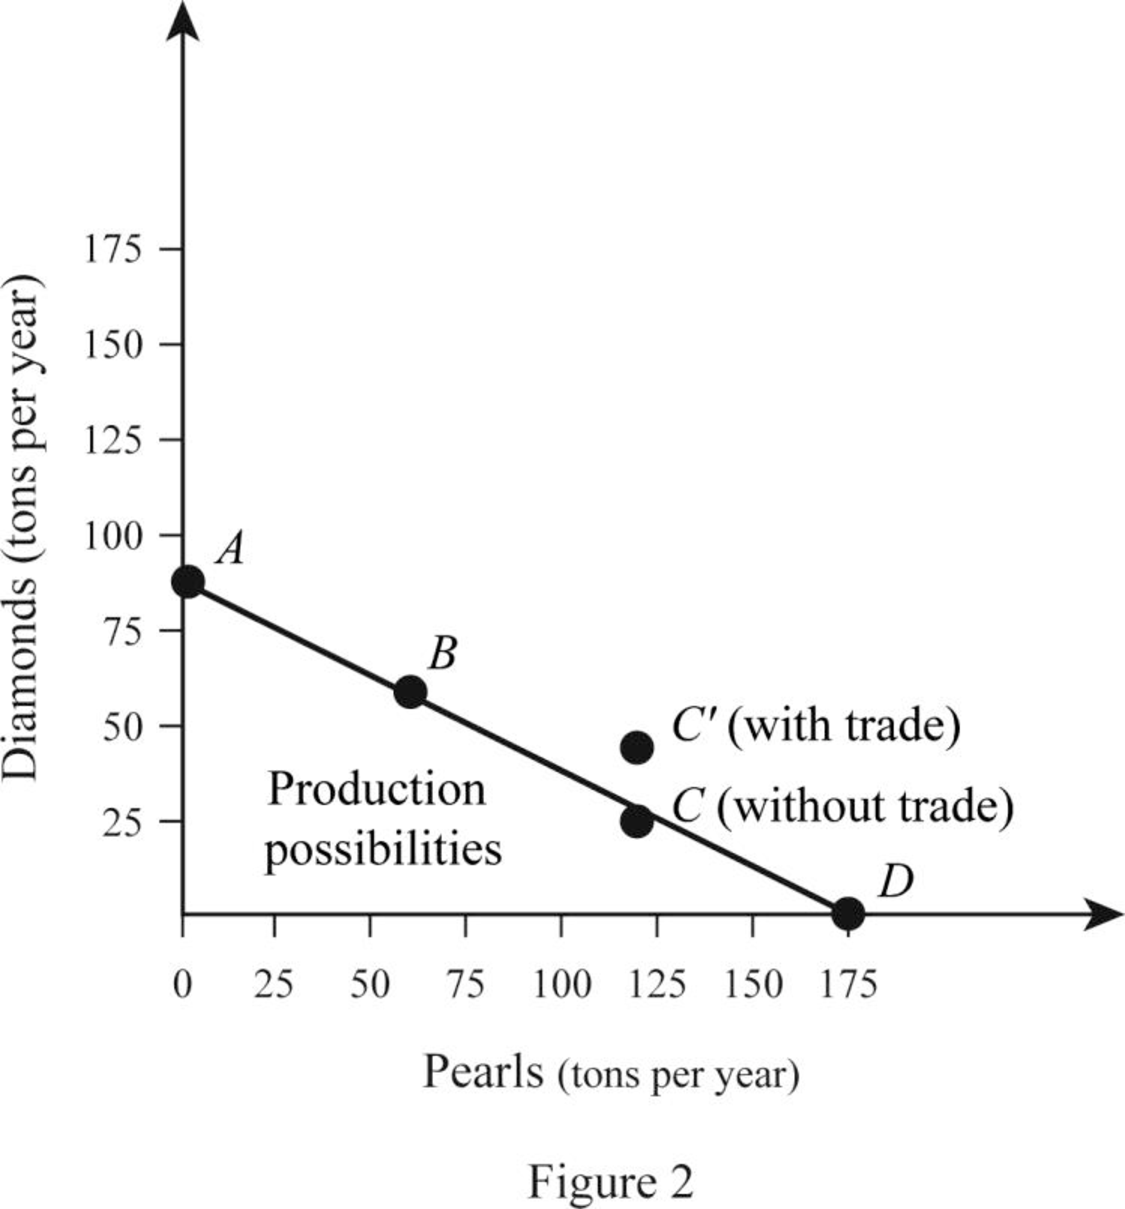
Therefore, the opportunity cost of producing a ton of Pearl is 2 tons of Pearls in Country A. Similarly, Country B can produce either 90 tons of Diamonds or 180 tons of Pearls. Thus, the opportunity cost of producing Pearl for B can be calculated as follows:
Thus, the opportunity cost of producing a ton of Pearl for Country B is equal to
(c):
Commodity in which A has a
(c):
Explanation of Solution
The
In the case of Country A, the opportunity cost of producing a ton of Diamond is
(d):
Commodity in which Country B has a comparative advantage.
(d):
Explanation of Solution
In the case of Country A, the opportunity cost of producing a ton of Diamond is
From this, it can be identified that Country B could produce Pearls at a lower opportunity cost than Country A. This indicates that Country B has comparative advantage in the production of Pearls.
(e):
Benefit of specialization.
(e):
Explanation of Solution
Country A is in its PPC Curve B where it produces 100 tons of Diamonds and 25 tons of Pearls. Country B is on its PPC curve C where it produces 30 tons of Diamonds and 120 tons of Pearls. Thus, the total output is 130 tons of Diamonds and 145 tons of Pearls. When the country specializes, Country A produces only Diamonds, which is 150 tons and B produces only Pearls, which is 180 tons. Thus, the total output increases due to specialization by 20 tons of Diamonds and 35 tons of Pearls. This can be illustrated in a table as follows:
| Diamonds (in tons per year) | Pearls (In tons per year) | |
| Before Specialization | ||
| A (PPC point at B) | 100 | 25 |
| B (PP C point at C) | 30 | 120 |
| Total Output | 130 | 145 |
| After Specialization | ||
| A (PPC point at A) | 150 | 0 |
| B (PP C point at D) | 0 | 180 |
| Total Output | 150 | 180 |
Thus, the total output of Diamonds and Pearls increases as the economy specializes in the production of commodities in which they have comparative advantages.
(f):
Graphical representation of specialization and trade benefit for the countries.
(f):
Explanation of Solution
When there is no specialization and trade between A and B, Country A operates at PPC point B where it produces and consumes 100 tons of Diamonds and 25 tons of Pearls. The case with Country B is different and it operates at Point C of the PPC where it produces and consumes 30 tons of Diamonds and 120 tons of Pearls. When the country specializes, Country A produces 150 tons of Diamonds and Country B produces 180 tons of pearls.
When the trade takes place, Country A trades 50 tons of Diamonds in exchange for 50 tons of Pearls with Country B. This means that Country A is able to consume 100 tons of Diamonds and 50 tons of Pearl whereas Country B is able to consume 50 tons of Diamonds and 130 tons of Pearls. Thus, both countries are able to achieve a consumption point beyond their PPC which can be illustrated as follows:
Want to see more full solutions like this?
Chapter 28 Solutions
Bundle: Economics for Today, Loose-leaf Version, 10th + MindTap Economics, 2 terms (12 months) Printed Access Card

- In what ways could you show the attractiveness of Philippines in the form of videos/campaigns to foreign investors? Cite 10 examples.arrow_forwardExplain the following terms and provide an example for each term: • Corruption • Fraud • Briberyarrow_forwardIn what ways could you show the attractiveness of a country in the form of videos/campaigns?arrow_forward
- With the VBS scenario in mind, debate with your own words the view that stakeholders are the primary reason why business ethics must be implemented.arrow_forwardThe unethical decisions taken by the VBS management affected the lives of many of their clients who trusted their business and services You are appointed as an ethics officer at Tyme Bank. Advise the management regarding the role of legislation in South Africa in providing the legal framework for business operations.arrow_forwardTyme Bank is a developing bank in South Africa and could potentially encounter challenges similar to those faced by VBS in the future. Explain five (5) benefits of applying business ethics at Tyme Bank to prevent similar ethical scandals.arrow_forward
- 1.3. Explain the five (5) ethical challenges that can be associated with the implementation of the National Health Insurance (NHI) in South Africa.arrow_forward1.2. Fourie (2018:211) suggests that Ubuntu emphasises the willingness to share and participate in a community. However, it does not privilege the community over the dignity and life of the individual. With the above in mind, discuss how the implementation of the National Health Insurance (NHI) is a way to uphold the concept of Ubuntu.arrow_forwardWhat are the 15 things/places/foods/culture or any strategies that could showcase the attractiveness of the Philippines to foreign investors? Use factual information in each strategies and discuss.arrow_forward
- Two firms are competing in a Cournot duopoly. Both firms have the same constant marginal cost. The market demand is linear. Suppose the constant marginal cost of firm 2 is increasing. Which of the following statements are correct? [There may be more than one correct statement.] The quantity of firm 1 and the quantity of firm 2 both go up. The quantity of firm 1 goes up and the quantity of firm 2 goes down. The market price goes down. The market price goes up. The quantity of firm 1 and the quantity of firm 2 go down. The quantity of firm 1 goes down and the quantity of firm 2 goes up. The market price stays the same.arrow_forwardevaluate the impact of government interventions, such as antitrust regulations, price controls, or subsidies, on various market structures. Select a specific industry and examine how these interventions have influenced competition, consumer welfare, and economic efficiency. Provide the pros and cons of government intervention.arrow_forwardConsider an economy that exhibits both population growth (L grows at rate n) and technological progress (A grows at rate a) described by the production function, Y = F(K, AL) = Ka (AL)¹-α Here K is capital and Y is output. (a) Show that this production function exhibits constant returns to scale. [2 marks] (b) What is the per-effective-worker production function, y = f(k), (where y = Y/AL k K/AL)? (Show your working.) [2 marks] (c) Find expressions for the steady-state capital-output ratio, capital stock per effective worker, and output per effective worker, as a function of the saving rate (s), the depreciation rate (8), the population growth rate (n), the rate of technological progress (a), and the coefficient a. (You may assume the condition that capital per effective worker evolves according to Ak = sf (k) - (a+n+8)k.) [5 marks] (d) Show that at the Golden Rule steady state the saving rate for this economy is equal to the parameter a. [6 marks]arrow_forward


 Economics (MindTap Course List)EconomicsISBN:9781337617383Author:Roger A. ArnoldPublisher:Cengage Learning