
(a):
(a):
Explanation of Solution
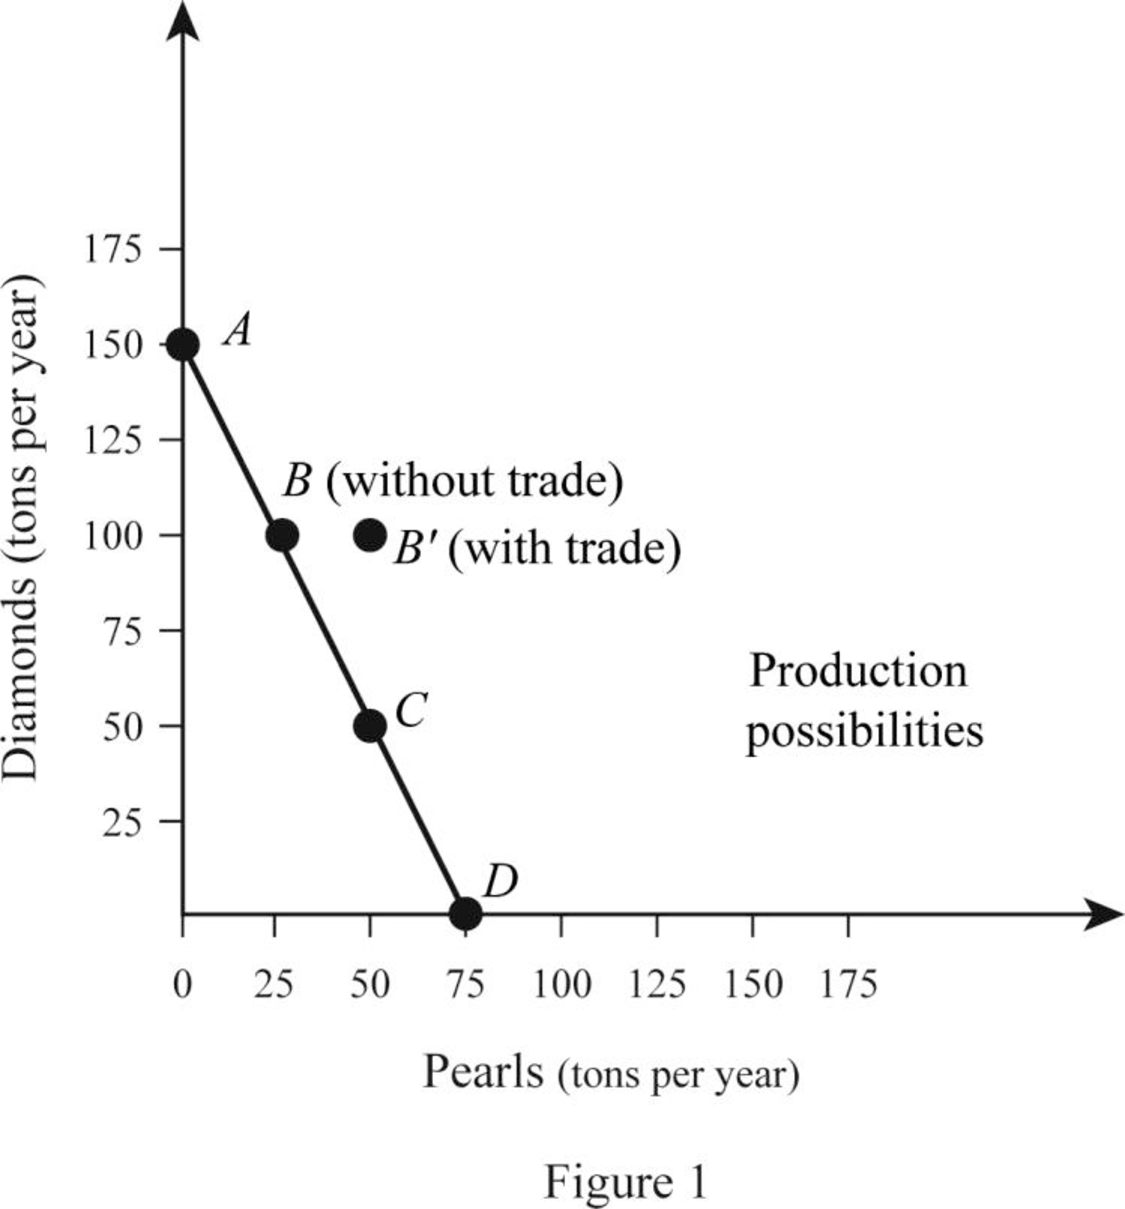
The opportunity cost of producing a commodity can be calculated by dividing the total quantity of Pearls lost with the Diamonds gained for the country. Country A produces either 150 tons of Diamonds or 75 ton of Pearls. Thus, the opportunity cost can be calculated as follows:
Therefore, the opportunity cost of producing a ton of Diamond is
Thus, the opportunity cost of producing a ton of Diamond for Country B is equal to 2 tons of Pearls.
Opportunity cost: Opportunity cost is the cost of the next best alternatives that is foregone while making the choices. When the resources are used for the production of Commodity A, Commodity B that could be made with that same quantity of resource will be the opportunity cost.
(b):
Opportunity cost of producing Pearls.
(b):
Explanation of Solution
The opportunity cost of producing Pearl can be calculated by dividing the total quantity of Diamonds lost with the Pearls gained for the country. Country A produces either 150 tons of Diamonds or 75 ton of Pearl. Thus, the opportunity cost can be calculated as follows:
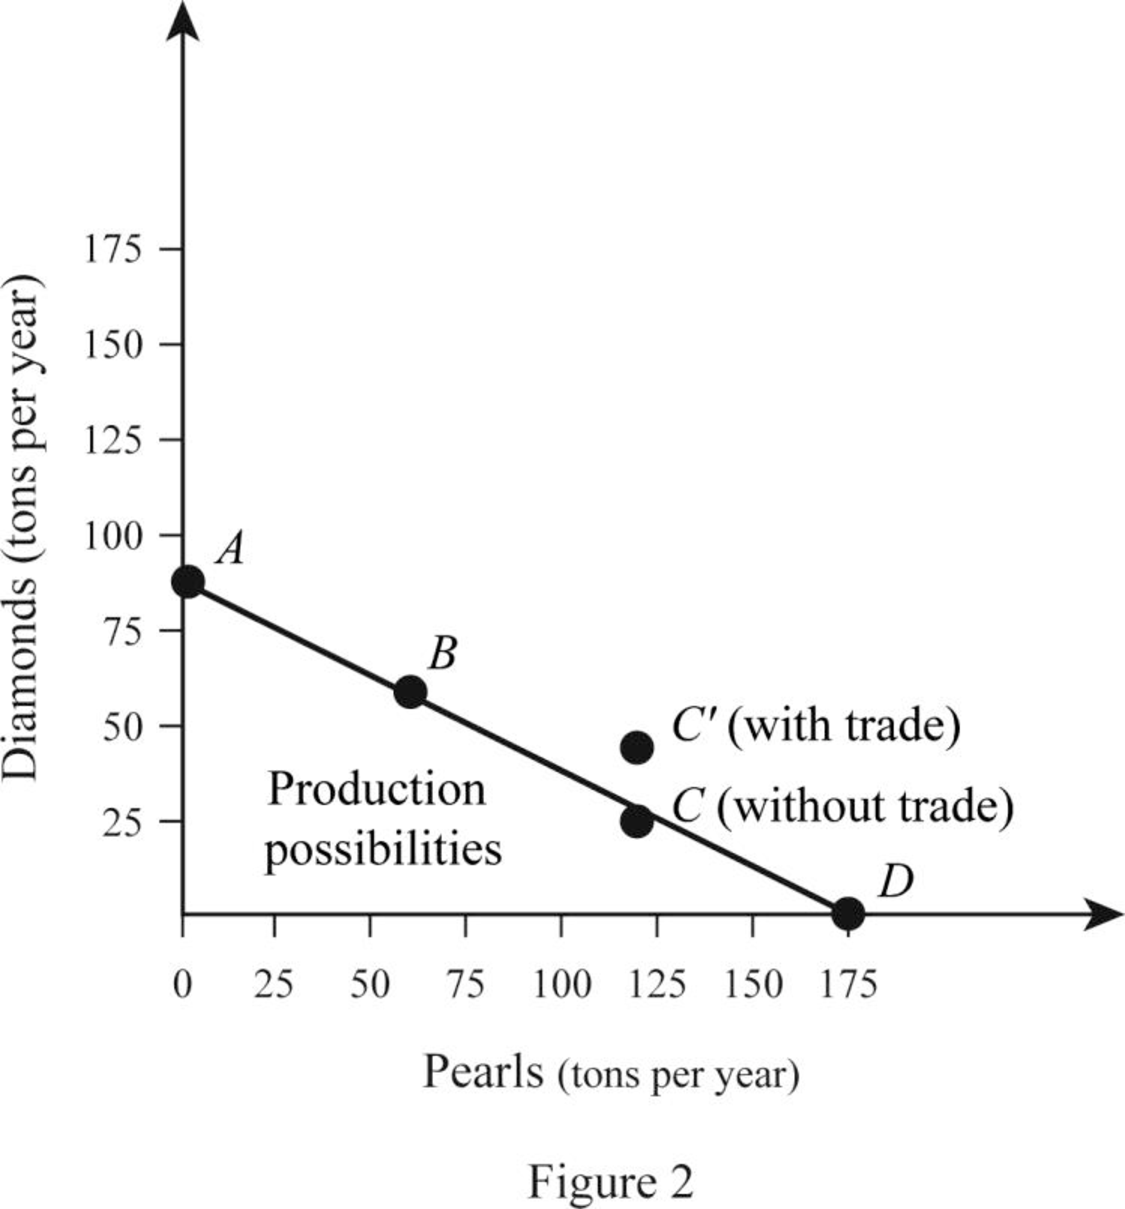
Therefore, the opportunity cost of producing a ton of Pearl is 2 tons of Pearls in Country A. Similarly, Country B can produce either 90 tons of Diamonds or 180 tons of Pearls. Thus, the opportunity cost of producing Pearl for B can be calculated as follows:
Thus, the opportunity cost of producing a ton of Pearl for Country B is equal to
(c):
Commodity in which A has a
(c):
Explanation of Solution
The
In the case of Country A, the opportunity cost of producing a ton of Diamond is
(d):
Commodity in which Country B has a comparative advantage.
(d):
Explanation of Solution
In the case of Country A, the opportunity cost of producing a ton of Diamond is
From this, it can be identified that Country B could produce Pearls at a lower opportunity cost than Country A. This indicates that Country B has comparative advantage in the production of Pearls.
(e):
Benefit of specialization.
(e):
Explanation of Solution
Country A is in its PPC Curve B where it produces 100 tons of Diamonds and 25 tons of Pearls. Country B is on its PPC curve C where it produces 30 tons of Diamonds and 120 tons of Pearls. Thus, the total output is 130 tons of Diamonds and 145 tons of Pearls. When the country specializes, Country A produces only Diamonds, which is 150 tons and B produces only Pearls, which is 180 tons. Thus, the total output increases due to specialization by 20 tons of Diamonds and 35 tons of Pearls. This can be illustrated in a table as follows:
| Diamonds (in tons per year) | Pearls (In tons per year) | |
| Before Specialization | ||
| A (PPC point at B) | 100 | 25 |
| B (PP C point at C) | 30 | 120 |
| Total Output | 130 | 145 |
| After Specialization | ||
| A (PPC point at A) | 150 | 0 |
| B (PP C point at D) | 0 | 180 |
| Total Output | 150 | 180 |
Thus, the total output of Diamonds and Pearls increases as the economy specializes in the production of commodities in which they have comparative advantages.
(f):
Graphical representation of specialization and trade benefit for the countries.
(f):
Explanation of Solution
When there is no specialization and trade between A and B, Country A operates at PPC point B where it produces and consumes 100 tons of Diamonds and 25 tons of Pearls. The case with Country B is different and it operates at Point C of the PPC where it produces and consumes 30 tons of Diamonds and 120 tons of Pearls. When the country specializes, Country A produces 150 tons of Diamonds and Country B produces 180 tons of pearls.
When the trade takes place, Country A trades 50 tons of Diamonds in exchange for 50 tons of Pearls with Country B. This means that Country A is able to consume 100 tons of Diamonds and 50 tons of Pearl whereas Country B is able to consume 50 tons of Diamonds and 130 tons of Pearls. Thus, both countries are able to achieve a consumption point beyond their PPC which can be illustrated as follows:
Want to see more full solutions like this?
Chapter 28 Solutions
Economics For Today

- Your marketing department has identified the following customer demographics in the following table. Construct a demand curve and determine the profit maximizing price as well as the expected profit if MC=$1. The number of customers in the target population is 10,000. Group Value Frequency Baby boomers $5 20% Generation X $4 10% Generation Y $3 10% `Tweeners $2 10% Seniors $2 10% Others $0 40% ur marketing department has identified the following customer demographics in the following table. Construct a demand curve and determine the profit maximizing price as well as the expected profit if MC=$1. The number of customers in the target population is 10,000.arrow_forwardTest Preparation QUESTION 2 [20] 2.1 Body Mass Index (BMI) is a summary measure of relative health. It is calculated by dividing an individual's weight (in kilograms) by the square of their height (in meters). A small sample was drawn from the population of UWC students to determine the effect of exercise on BMI score. Given the following table, find the constant and slope parameters of the sample regression function of BMI = f(Weekly exercise hours). Interpret the two estimated parameter values. X (Weekly exercise hours) Y (Body-Mass index) QUESTION 3 2 4 6 8 10 12 41 38 33 27 23 19 Derek investigates the relationship between the days (per year) absent from work (ABSENT) and the number of years taken for the worker to be promoted (PROMOTION). He interviewed a sample of 22 employees in Cape Town to obtain information on ABSENT (X) and PROMOTION (Y), and derived the following: ΣΧ ΣΥ 341 ΣΧΥ 176 ΣΧ 1187 1012 3.1 By using the OLS method, prove that the constant and slope parameters of the…arrow_forwardQUESTION 2 2.1 [30] Mariana, a researcher at the World Health Organisation (WHO), collects information on weekly study hours (HOURS) and blood pressure level when writing a test (BLOOD) from a sample of university students across the country, before running the regression BLOOD = f(STUDY). She collects data from 5 students as listed below: X (STUDY) 2 Y (BLOOD) 4 6 8 10 141 138 133 127 123 2.1.1 By using the OLS method and the information above derive the values for parameters B1 and B2. 2.1.2 Derive the RSS (sum of squares for the residuals). 2.1.3 Hence, calculate ô 2.2 2.3 (6) (3) Further, she replicates her study and collects data from 122 students from a rival university. She derives the residuals followed by computing skewness (S) equals -1.25 and kurtosis (K) equals 8.25 for the rival university data. Conduct the Jacque-Bera test of normality at a = 0.05. (5) Upon tasked with deriving estimates of ẞ1, B2, 82 and the standard errors (SE) of ẞ1 and B₂ for the replicated data.…arrow_forward
- If you were put in charge of ensuring that the mining industry in canada becomes more sustainable over the course of the next decade (2025-2035), how would you approach this? Come up with (at least) one resolution for each of the 4 major types of conflict: social, environmental, economic, and politicalarrow_forwardHow is the mining industry related to other Canadian labour industries? Choose one other industry, (I chose Forestry)and describe how it is related to the mining industry. How do the two industries work together? Do they ever conflict, or do they work well together?arrow_forwardWhat is the primary, secondary, tertiary, and quaternary levels of mining in Canada For each level, describe what types of careers are the most common, and describe what stage your industry’s main resource is in during that stagearrow_forward
- How does the mining industry in canada contribute to the Canadian economy? Describe why your industry is so important to the Canadian economy What would happen if your industry disappeared, or suffered significant layoffs?arrow_forwardWhat is already being done to make mining in canada more sustainable? What efforts are being made in order to make mining more sustainable?arrow_forwardWhat are the environmental challenges the canadian mining industry face? Discuss current challenges that mining faces with regard to the environmentarrow_forward
- What sustainability efforts have been put forth in the mining industry in canada Are your industry’s resources renewable or non-renewable? How do you know? Describe your industry’s reclamation processarrow_forwardHow does oligopolies practice non-price competition in South Africa?arrow_forwardWhat are the advantages and disadvantages of oligopolies on the consumers, businesses and the economy as a whole?arrow_forward


 Economics (MindTap Course List)EconomicsISBN:9781337617383Author:Roger A. ArnoldPublisher:Cengage Learning