
Videos
Perform the same computation for the Lorenz equations in Sec. 28.2, but use (a) Euler's method, (b) Heun's method (without iterating the corrector), (c) the fourth-order RK method, and (d) the MATLAB ode45 function. In all cases use single-precision variables and a step size of 0.1 and simulate from
(a)
To calculate: The solution of Lorentz equation
Answer to Problem 18P
Solution:
The solution of Lorentz equations by the Euler’s method with step size 0.1 gives unstable solution.
Explanation of Solution
Given Information:
Lorentz equations,
and Initial conditions are
Formula used:
Euler’s method for
Where, h is the step size.
Calculation:
Consider the equations,
The iteration formula for Euler’s method with step size
Use excel to find all the iteration with step size
Step 1: Name the column A as t and go to column A2 and put 0 then go to column A3 and write the formula as,
=A2+0.1
Then, Press enter and drag the column up to
Step 2: Now name the column B as x-Euler and go to column B2 and write 5 and then go to the column B3 and write the formula as,
=B2+0.1*(-10*B2+10*C2)
Step 3: Press enter and drag the column up to
Step 4: Now name the column C as y-Euler and go to column C2 and write 5 and then go to the column C3 and write the formula as,
=C2+0.1*(28*B2-C2-B2*D2)
Step 5: Press enter and drag the column up to
Step 6: Now name the column D as z-Euler and go to column D2 and write 5 and then go to the column D3 and write the formula as,
=D2+0.1*(-2.666667*D2+B2*C2)
Step 7: Press enter and drag the column up to
Thus, first few iterations are as shown below,
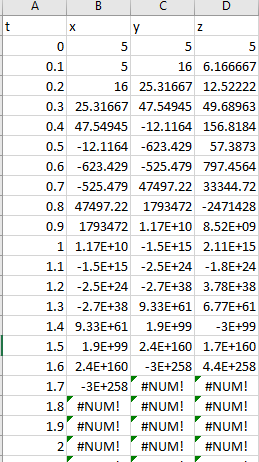
From the above result, it is observed that the solution of Lorentz equations by the Euler’s method with step size 0.1 the values are continuously decreasing. Hence, Euler method with step size 0.1 gives unstable solution for the Lorentz equations.
(b)
To calculate: The solution of Lorentz equation
Answer to Problem 18P
Solution:
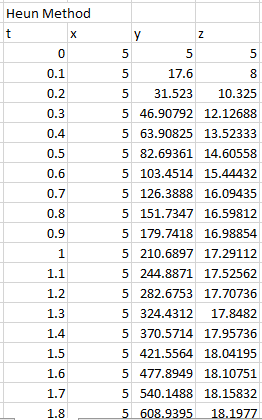
The solution of Lorentz equations by the Heun’s method with step size 0.1 gives unstable solution.
Explanation of Solution
Given Information:
Lorentz equations,
and Initial conditions are
Formula used:
The iteration formula for Heun’s method is,
Calculation:
Consider the equations,
The following VBA code is used to solve the Lorentz equation by Heun’s method:
Code:
Output:
To draw the graph of the above results, follow the steps in excel sheet as given below,
Step 1: Select the cell from A4 to A205 and cell B4 to B205. Then, go to the Insert and select the scatter with smooth lines from the chart.
Step 2: Select the cell from A4 to A205 and cell C4 to C205. Then, go to the Insert and select the scatter with smooth lines from the chart.
Step 2: Select the cell from A4 to A205 and cell D4 to D205. Then, go to the Insert and select the scatter with smooth lines from the chart.
Step 4: Select one of the graphs and paste it on another graph to merge the graphs.
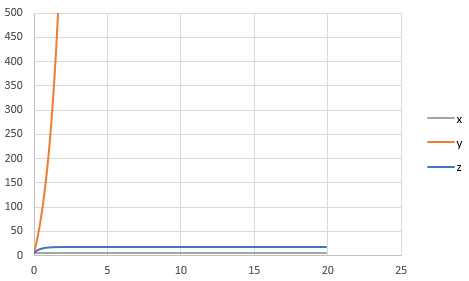
The graph obtained is,
And, to draw the phase plane plot follow the steps as below,
Step 4: Select the column B, column C and column D. Then, go to the Insert and select the scatter with smooth lines from the chart.
The graph obtained is,
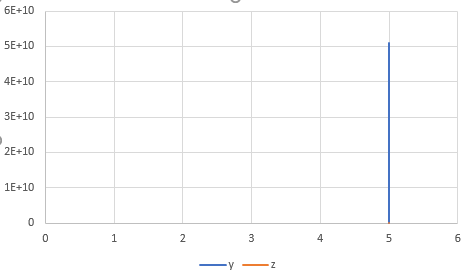
The phase plane plot is a straight line because solution of x is a constant value. The solution o0f Lorentz equation by Heun’s method with step size 0.1 is thus unstable.
(c)
To calculate: The solution of Lorentz equation
Answer to Problem 18P
Solution:
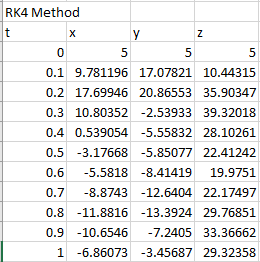
The first few solutions of Lorentz equation are,
| t | x | y | z |
| 0 | 5 | 5 | 5 |
| 0.1 | 9.781196 | 17.07821 | 10.44315 |
| 0.2 | 17.69946 | 20.86553 | 35.90347 |
| 0.3 | 10.80352 | -2.53933 | 39.32018 |
| 0.4 | 0.539054 | -5.55832 | 28.10261 |
| 0.5 | -3.17668 | -5.85077 | 22.41242 |
| 0.6 | -5.5818 | -8.41419 | 19.9751 |
| 0.7 | -8.8743 | -12.6404 | 22.17497 |
| 0.8 | -11.8816 | -13.3924 | 29.76851 |
| 0.9 | -10.6546 | -7.2405 | 33.36662 |
| 1 | -6.86073 | -3.45687 | 29.32358 |
Explanation of Solution
Given Information:
Lorentz equations,
and Initial conditions are
Formula used:
The fourth-order RK method for
Where,
Calculation:
The following VBA code is used to find the solution of Lorentz equation by the fourth order RK method:
Code:
Output:
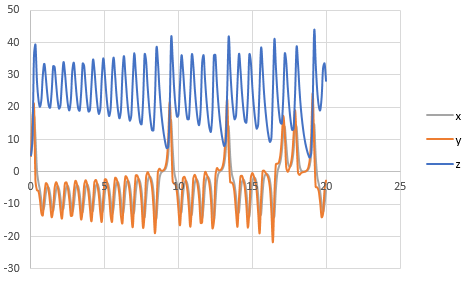
To draw the graph of the above results, follow the steps in excel sheet as given below,
Step 1: Select the cell from A4 to A205 and cell B4 to B205. Then, go to the Insert and select the scatter with smooth lines from the chart.
Step 2: Select the cell from A4 to A205 and cell C4 to C205. Then, go to the Insert and select the scatter with smooth lines from the chart.
Step 3: Select the cell from A4 to A205 and cell D4 to D205. Then, go to the Insert and select the scatter with smooth lines from the chart.
Step 4: Select one of the graphs and paste it on another graph to merge the graphs.
The graph obtained is,
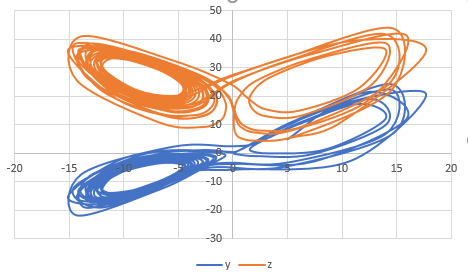
And, to draw the phase plane plot follow the steps as below,
Step 4: Select the column B, column C and column D. Then, go to the Insert and select the scatter with smooth lines from the chart.
The graph obtained is,
(d)
The solution of Lorentz equation
Answer to Problem 18P
Solution:
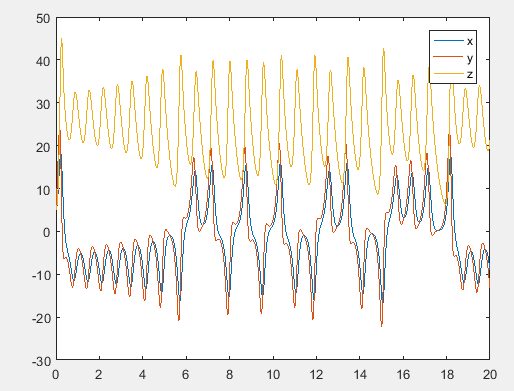
The solution graph of Lorentz equation is,
Explanation of Solution
Given Information:
Lorentz equations,
and Initial conditions are
Consider the Lorentz equations,
Use MATLAB ode45 function to solve the above differential functions as below,
Code:
Output:
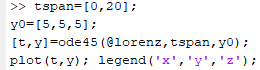
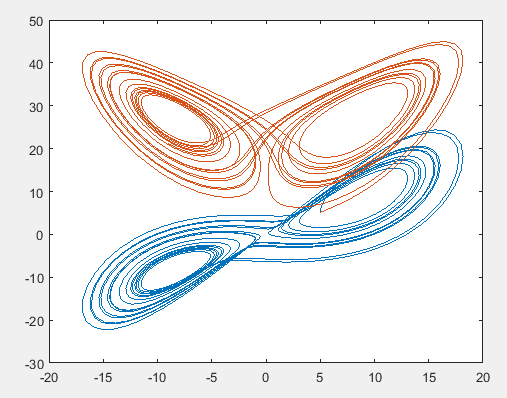
The graph obtained as,
Write the command as below to plot the phase-plane,

The phase plane graph obtained as,
Want to see more full solutions like this?
Chapter 28 Solutions
Numerical Methods For Engineers, 7 Ed
Additional Math Textbook Solutions
Mathematics for the Trades: A Guided Approach (11th Edition) (What's New in Trade Math)
Pathways To Math Literacy (looseleaf)
College Algebra (7th Edition)
Math in Our World
Precalculus: A Unit Circle Approach (3rd Edition)
Elementary & Intermediate Algebra


- 25.3. Find the Laurent series for the function z/[(22 + 1)(z² + 4)] in the following domains (a). 02.arrow_forward25.2. Find the Laurent series for the function 1/[z(z-1)] in the follow- ing domains: (a). 0<|z|< 1, (b). 1 <|z|, (c). 0<|z1|< 1, (d). 1< |z1|, (e). 1<|z2|<2.arrow_forward25.1. Expand each of the following functions f(z) in a Laurent series on the indicated domain: 22-2z+5 (z - 2) (z² + 1)' (z 11, 22 (a). (c). Log (2-8) where b>a> 1 are real, |z|> b. barrow_forward
- 25.5. Find the Laurent series for the function 1/[(2-1)(z-2)(z-3)] in the following domains: (a). 0 3.arrow_forwardCan you explain how the error term in the CF Algorithm relates to the (m+1)th complete quotient? Also, what would be a good way to explain the connection between these two slides? How can one transition between them for a presentation?arrow_forwardHow can I explain the pi example in a presentation? I'm having trouble transitioning between these two slidesarrow_forward
- McGilla Golf has decided to sell a new line of golf clubs. The clubs will sell for $895 per set and have a variable cost of $431 per set. The company has spent $200,000 for a marketing study that determined the company will sell 80,000 sets per year for seven years. The marketing study also determined that the company will lose sales of 8,600 sets per year of its high-priced clubs. The high-priced clubs sell at $1,325 and have variable costs of $645. The company will also increase sales of its cheap clubs by 10,800 sets per year. The cheap clubs sell for $340 and have variable costs of $141 per set. The fixed costs each year will be $14,350,000. The company has also spent $1,500,000 on research and development for the new clubs. The plant and equipment required will cost $43,700,000 and will be depreciated on a straight-line basis. The new clubs will also require an increase in net working capital of $3,625,000 that will be returned at the end of the project. The tax rate is 25…arrow_forwardTri-County Utilities, Inc., supplies natural gas to customers in a three-county area. The company purchases natural gas from two companies: Southern Gas and Northwest Gas. Demand forecasts for the coming winter season are as follows: Hamilton County, 400 units; Butler County, 200 units; and Clermont County, 300 units. Contracts to provide the following quantities have been written: Southern Gas, 500 units; and Northwest Gas, 400 units. Distribution costs for the counties vary, depending upon the location of the suppliers. The distribution costs per unit (in thousands of dollars) are as follows. From To Hamilton Butler Clermont Southern Gas 10 20 15 Northwest Gas 12 15 18 (a) Develop a network representation of this problem. (Submit a file with a maximum size of 1 MB.) Choose File No file chosen Assignment 3 graph.docx Score: 1 out of 1 Comment: (b) Develop a linear programming model that can be used to determine the plan that will minimize total distribution costs (in thousands of…arrow_forwardUse the method of undetermined coefficients to solve the given nonhomogeneous system. dx dt = 2x + 3y − 8 dy dt = −x − 2y + 6 X(t) =arrow_forward
- As discussed in Section 8.3, the Markowitz model uses the variance of the portfolio as the measure of risk. However, variance includes deviations both below and above the mean return. Semivariance includes only deviations below the mean and is considered by many to be a better measure of risk. (a) Develop a model that minimizes semivariance for the Hauck Financial data given in the file HauckData with a required return of 10%. Assume that the five planning scenarios in the Hauck Financial Services model are equally likely to occur. Hint: Modify model (8.10)–(8.19). Define a variable ds for each scenario and let ds ≥ R − Rs with ds ≥ 0. Then make the objective function: Min 1 5 5 s = 1 ds2. Let FS = proportion of portfolio invested in the foreign stock mutual fund IB = proportion of portfolio invested in the intermediate-term bond fund LG = proportion of portfolio invested in the large-cap growth fund LV = proportion of portfolio invested in the large-cap value fund…arrow_forwardFor each month of the year, Taylor collected the average high temperatures in Jackson, Mississippi. He used the data to create the histogram shown. Which set of data did he use to create the histogram? A 55, 60, 64, 72, 73, 75, 77, 81, 83, 91, 91, 92\ 55,\ 60,\ 64,\ 72,\ 73,\ 75,\ 77,\ 81,\ 83,\ 91,\ 91,\ 92 55, 60, 64, 72, 73, 75, 77, 81, 83, 91, 91, 92 B 55, 57, 60, 65, 70, 71, 78, 79, 85, 86, 88, 91\ 55,\ 57,\ 60,\ 65,\ 70,\ 71,\ 78,\ 79,\ 85,\ 86,\ 88,\ 91 55, 57, 60, 65, 70, 71, 78, 79, 85, 86, 88, 91 C 55, 60, 63, 64, 65, 71, 83, 87, 88, 88, 89, 93\ 55,\ 60,\ 63,\ 64,\ 65,\ 71,\ 83,\ 87,\ 88,\ 88,\ 89,\ 93 55, 60, 63, 64, 65, 71, 83, 87, 88, 88, 89, 93 D 55, 58, 60, 66, 68, 75, 77, 82, 86, 89, 91, 91\ 55,\ 58,\ 60,\ 66,\ 68,\ 75,\ 77,\ 82,\ 86,\ 89,\ 91,\ 91 55, 58, 60, 66, 68, 75, 77, 82, 86, 89, 91, 91arrow_forward3. Consider the polynomial equation 6-iz+7z2-iz³ +z = 0 for which the roots are 3i, -2i, -i, and i. (a) Verify the relations between this roots and the coefficients of the polynomial. (b) Find the annulus region in which the roots lie.arrow_forward
 Algebra & Trigonometry with Analytic GeometryAlgebraISBN:9781133382119Author:SwokowskiPublisher:Cengage