
Identify the effect of the events on the quantity of real
Explanation of Solution
- The U.S firm move their call handling, IT, and data function to Country I:
A movement of call handling, IT, and data function from the U.D firm to Country I’s firm will cause an expansion of a business. In order to expand the business of the firm, it will result in demanding new capital, increase employment, and production. Therefore, the quantity of real GDP supplies and aggregate supply will increase.
Figure -1 shows the effect of movement of business from one firm to other firms as follows:
In Figure -1, the horizontal axis measures real GDP and the vertical axis measures
In Figure -1, the curve short-run aggregate supply (SAS), long-run
- Fuel price rise:
A rise in fuel price will result in an increase in the price level, which will rise the cost of production and temporarily decrease the aggregate supply. This will cause the short-run supply shift to the leftward direction and long-run aggregate supply curve remain unchanged.
Figure -2 shows the impact of rising in fuel price as follows:

In Figure -2, the horizontal axis measures real GDP and the vertical axis measures price level.
In Figure -2, point E represents the initial equilibrium of the economy. Since as the rise in price cause a temporary decrease in short-run aggregate supply, which result in short-run aggregate supply curve shift to the leftward direction. Therefore, point E1 represents the new equilibrium point and SAS1 is the new short-run aggregate supply curve.
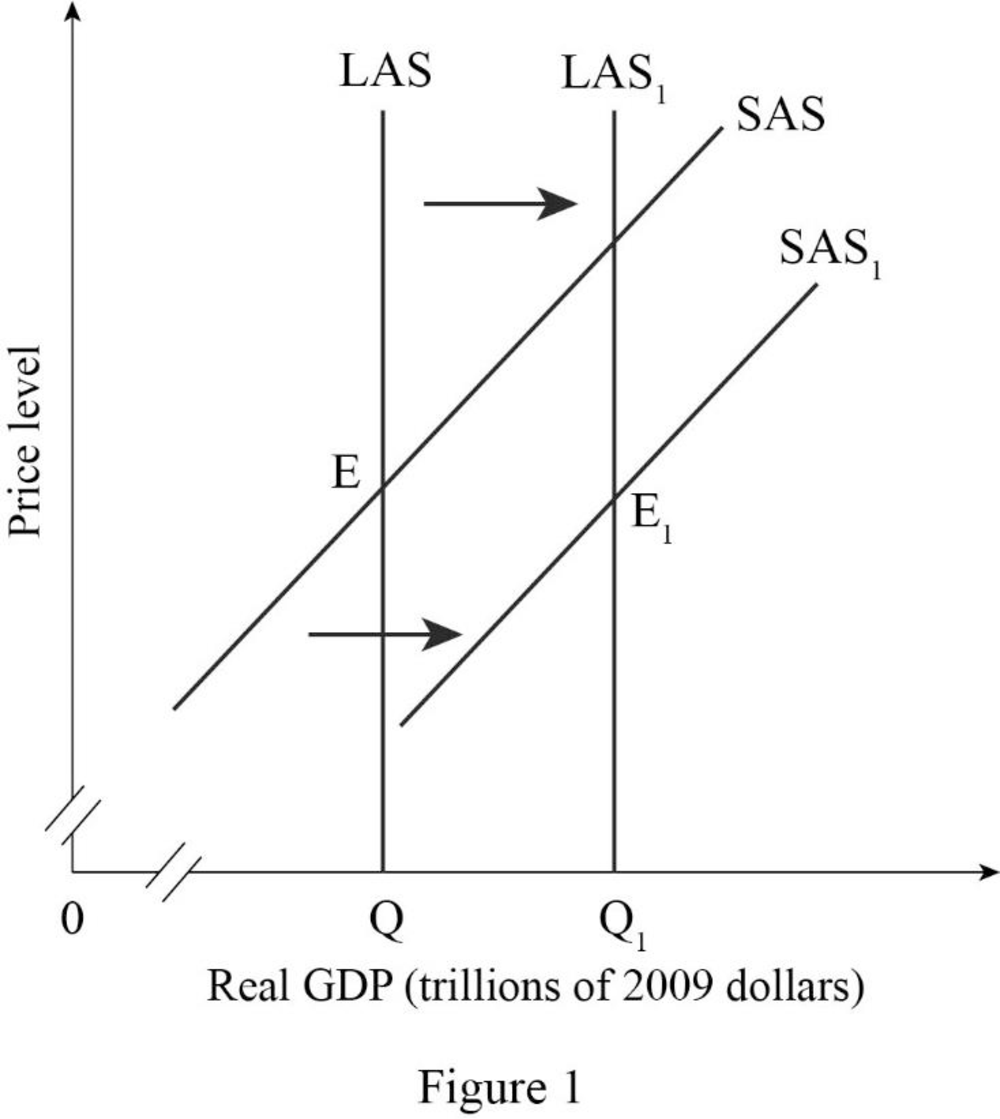
- Walmart and Starbucks open in Country I:
The Walmart and Starbucks open in Country I, which causes an expansion of their business. In order to expend the business of the firm, which will result in demanding new capital, increased employment, and production. Therefore, the quantity of real GDP supplies and aggregate supply will increase.
Figure -3 shows the effect of the expansion of business from one country to another country as follows:

In Figure -3, the horizontal axis measures real GDP and the vertical axis measures price level.
In Figure -3, the curve short-run aggregate supply (SAS), long-run aggregate supply curve (LAS) at output Q represents the initial outcome of the economy. The result of the expansion of a business into one country to another country will cause an increase in long-run aggregate supply and short run aggregate supply and will result in a long-run aggregate supply curve (LAS1) and short-run aggregate supply curve (SAS1) shift to the rightward direction.
- Universities in the Country I increase the number of engineering graduates.
An increase in the number of engineering graduates in Country I will result in an increase in human capital and opportunity of employment expansion. Therefore, the quantity of real GDP supplies and aggregate supply will increase.
Figure -4 shows the effect of expansion of business from one country to another country as follows:

In Figure -4, the horizontal axis measures real GDP and the vertical axis measures price level.
In Figure -4, the curve short-run aggregate supply (SAS), long-run aggregate supply curve (LAS) at output Q represents the initial outcome of the economy. The result of an increase in the human capital and employment opportunity will cause an increase in long-run aggregate supply and short-run aggregate supply, which will result in a long-run aggregate supply curve (LAS1) and short-run aggregate supply curve (SAS1) shift to the rightward direction.
- The money wage rate rises:
An increase in the money wage rate causes an increase in the cost of production of the firm because with the existing employment rate, the firm will pay a high salary or wage for the same quantity of output. Therefore, there occur a temporarily decrease in the aggregate supply, which will cause the short-run supply to shift to the leftward direction and long-run aggregate supply curve remain unchanged.
Figure -5 shows the effect of a rise in the money wage rate as follows:
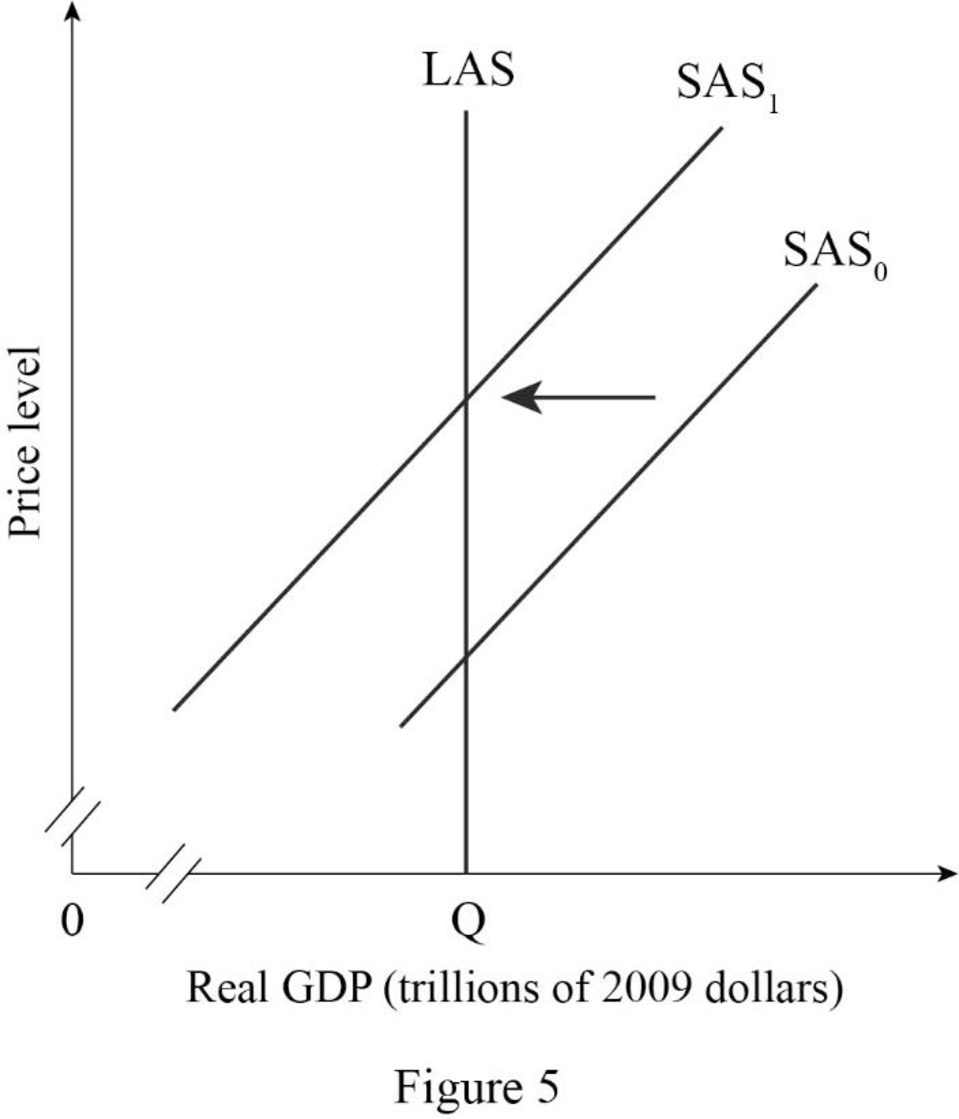
In Figure -5, the horizontal axis measures real GDP and the vertical axis measures price level.
In Figure -5, point E represents the initial equilibrium of the economy. Since as a rise in money wage rate causes a temporary decrease in short-run aggregate supply, which results in short-run aggregate supply curve shift to the leftward direction. Therefore, point E1 represents new equilibrium point and SAS1 is the new short-run aggregate supply curve.
- The price level in Country I increases:
In the short-run, an increase in the price level in the Country I cause an increase in the quantity supply of real GDP. Since an increase in price level causes an increase in the money wage rate, hence, in the long run, there occur an upward movement or real GDP along with long-run aggregate supply curve.
Figure -6 shows the impact of rise in the price level in Country I as follows:
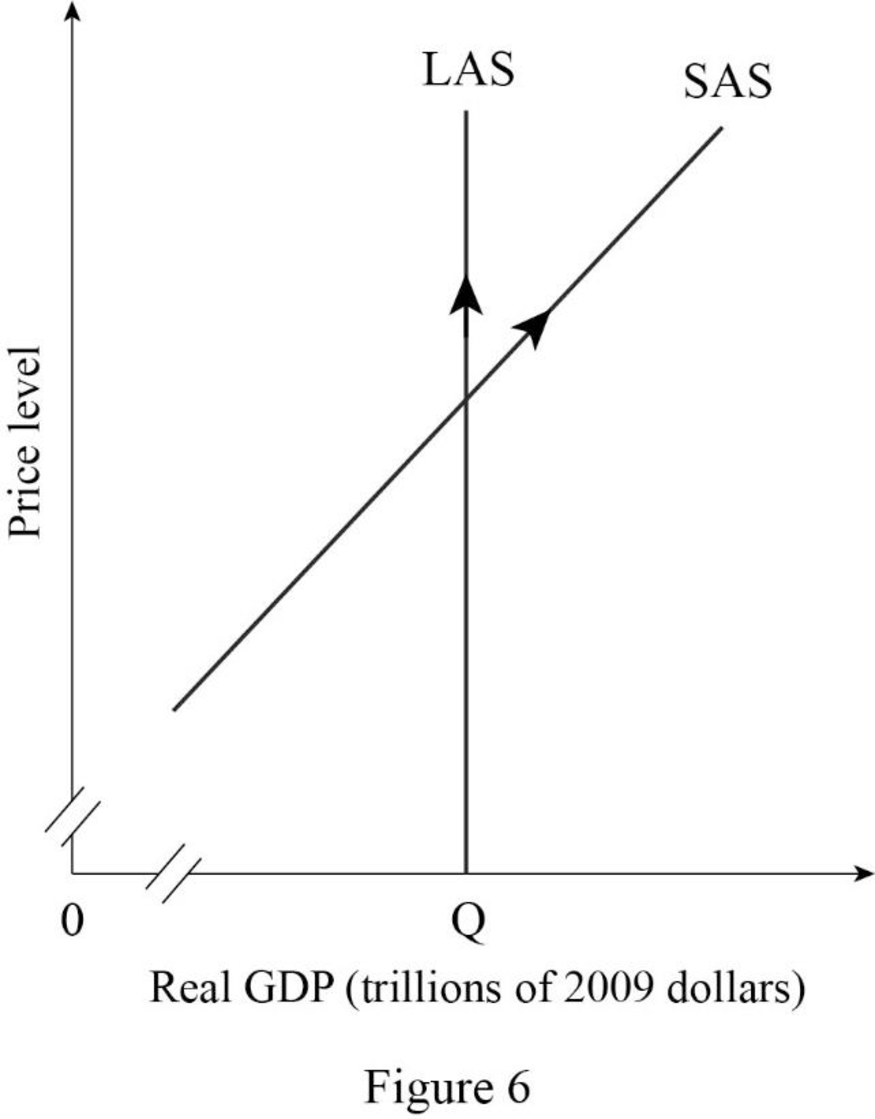
In Figure -6, the horizontal axis measures real GDP and the vertical axis measures price level.
In Figure -6, a rising in the price level causes a rise in money wage rate, hence in the long-run, the quantity supplied of real GDP increases. Therefore, there occurs an upward movement along with the long-run aggregate supply curve and the short-run aggregate supply curve.
Want to see more full solutions like this?
Chapter 27 Solutions
Macroeconomics

- what is change in TC / change in Q? and what would be an example?arrow_forwardhow to solve the attachment?arrow_forwardProblem 3-ABC Challenges: Attrition, Balance and ComplianceCan television inform people about public affairs? Political scientists Bethany Albertson and Adria Lawrence (2009) conducted an experiment in which they randomly assigned people to treatment and control groups to evaluate the effect of watching TV on a person’s information level. Those assigned to the treatment group were told to watch a specific television broadcast and were later asked questions related to what they watched. Those in the controlgroup were not shown the TV broadcast but were asked questions related to the material in the TV broadcast. The dataset contains the following variables: : Dummy variable which =1 if a person reads news and 0 otherwise. : interest in political affairs (not interested=1 to very interested=4) : years of education : female dummy variable (female=1; male=0) : family income in thousands of dollars : information level (low information level=1 to high information level=4) =1 if the…arrow_forward
- Problem 2-Experiments/Randomized Control Trial Suppose you are interested in studying the effect of academic counselling on the years it takes for a student to obtain an undergraduate degree. You conduct a randomized control trial to answer the question. You randomly assign 2500 individuals in a university in New York to receive academic counselling and 2500 students to not receive any academic counselling. a. Which people are a part of the treatment group and which people are a part of thecontrol group? b. What regression will you run? Define the variables where required. c. Suppose you estimate = -0.3. Interpret it. d. You test for balance using the variables mentioned in the table below. Based on the results do you think that the treatment and control group are balanced? If your answer is “yes” then explain why. If your answer is “no”, then explain why and mention how will you address the issue of imbalance. e. Suppose that some unmotivated students in the control group decided to…arrow_forwardHow to calculate total cost?arrow_forwardProblem 1-Experiments/Randomized Control TrialSuppose you are interested in studying the effect of being a part of the labor union on anindividual’s hourly wage.You collect data on 1000 people and run the following regression. where is a dummy variable which is equal t to 1 for people who are a part of labor union and0 for others. a. Suppose you estimate . Interpret b. Do you think is biased or unbiased? Explain. Now suppose you conduct a randomized control trial to answer the same question. Yourandomly assign some individuals to be a part of the labor union and others to not be a partof the labor union. The first step you take is to ensure that the randomization was donecorrectly. Then you estimate the following equation: =1 if the student is assigned to be a part of Labor Union=0 if the student is assigned to not be a part of Labor Union c. Why is it important to ensure that the randomization is done correctly? d. Name any two variables that you can use to test if Treatment and…arrow_forward
- What is kiosk?arrow_forwardIf food is produced in the U.S., sold in the U.S. and consumed in the U.S., a reduction in its price will have which of the following effects ______? Two of the answers are correct. The consumer price index will decrease. None of the answers are correct. The GDP deflator will decrease.arrow_forwardhow to caculate verible cost?arrow_forward
- What is the deficit?arrow_forwardIdentify the two curves shown on the graph, and explain their upward and downward slopes. Why does curve Aintersect the horizontal axis? What is the significance of quantity d? What does erepresent? How would the optimal quantity of information change if the marginal benefit of information increased—that is, if the marginal benefit curve shifted upward?arrow_forward6. Rent seeking The following graph shows the demand, marginal revenue, and marginal cost curves for a single-price monopolist that produces a drug that helps relieve arthritis pain. Place the grey point (star symbol) in the appropriate location on the graph to indicate the monopoly outcome such that the dashed lines reveal the profit-maximizing price and quantity of a single-price monopolist. Then, use the green rectangle (triangle symbols) to show the profits earned by the monopolist. 18 200 20 16 16 14 PRICE (Dollars per dose) 12 10 10 8 4 2 MC = ATC MR Demand 0 0 5 10 15 20 25 30 35 40 45 50 QUANTITY (Millions of doses per year) Monopoly Outcome Monopoly Profits Suppose that should the patent on this particular drug expire, the market would become perfectly competitive, with new firms immediately entering the market with essentially identical products. Further suppose that in this case the original firm will hire lobbyists and make donations to several key politicians to extend its…arrow_forward

 Macroeconomics: Private and Public Choice (MindTa...EconomicsISBN:9781305506756Author:James D. Gwartney, Richard L. Stroup, Russell S. Sobel, David A. MacphersonPublisher:Cengage Learning
 Economics: Private and Public Choice (MindTap Cou...EconomicsISBN:9781305506725Author:James D. Gwartney, Richard L. Stroup, Russell S. Sobel, David A. MacphersonPublisher:Cengage Learning
 Exploring EconomicsEconomicsISBN:9781544336329Author:Robert L. SextonPublisher:SAGE Publications, Inc
 Economics (MindTap Course List)EconomicsISBN:9781337617383Author:Roger A. ArnoldPublisher:Cengage Learning