The comparative advantage of countries.
Answer to Problem 2P
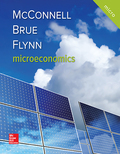
a. New Zealand- The cost of producing 1 Apple is 0.25 plums and the cost of producing 1 plum is 4 Apples.
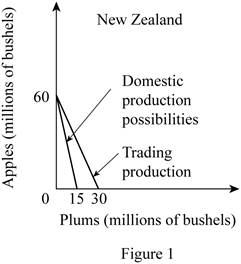
Spain- The cost of producing 1 Apple is 1 plum and the cost of producing 1 plum is 1 Apple.
b. New Zealand should produce apples and Spain should produce plums.
c. Graph
d. The total gain of Apples is 20 and the total gain of plums is 10.
Explanation of Solution
The comparative advantage is the advantage that the country has over the competitor in the
Option (a):
In New Zealand, the production of 20 apples needs the resources which can alternatively be used for the production of 5 plums. Thus, the opportunity cost of producing 1 apple can be calculated by dividing the total units of plums given up by the total units of apples gained as follows:
Thus, the opportunity cost of producing 1 apple in New Zealand is 0.25 plum.
The opportunity cost of producing plum in New Zealand can be calculated by dividing the number of units of apples given up with the number of units of plums gained as follows:
So, the opportunity cost of producing 1 plum in New Zealand is 4 apples.
In Spain, the production of 20 apples needs the resources which can alternatively be used for the production of 20 plums. Thus, the opportunity cost of producing 1 apple can be calculated by dividing the total units of plums given up by the total units of apples gained as follows:
Thus, the opportunity cost of producing 1 apple in Spain is 1 plum.
The opportunity cost of producing plum in Spain can be calculated by dividing the number of units of apples given up with the number of units of plums gained as follows:
So, the opportunity cost of producing 1 plum in Spain is 1 apple.
Option (b):
The opportunity cost of producing a unit of apple is lower in New Zealand (0.25 Plum) compared to Spain (1 Plum). Thus, New Zealand should specialize in the production of apples.
The opportunity cost of producing a unit of plum is lower in Spain (1 Apple) compared to that in New Zealand (4 Apples). Thus, Spain should specialize in the production of plums.
Option (c):
Before the trade, the
According to the terms of trade of
Similarly, Spain can have 2 apples for 1 plum in the international trade which will increase their total possible consumption of apples from 60 million bushels to 120 million bushels. Thus, the vertical intercept of the Spain's production possibility curve will increase to 120 million bushels. So, the slope of the production possibility curve of Spain will decrease from -1 to -0.5.
The changes are shown in the diagram as follows:
Option (d):
The mixed product of New Zealand is B and of Spain is S. According to the table, the total output of apples in New Zealand at this mixed product is 20 million bushels and the output of plums is 10 million bushels. Similarly, at the given output combination S of Spain, the total output of apples is 20 million bushes and of plums is 40 million bushels.
Thus, the total output of the apple and plum before the trade can be calculated by adding the individual quantities of apples that are produced in New Zealand and Spain together are as follows:
Thus, the total output of apples before the trade was 40 million bushels.
Similarly, the total output of plums can be calculated by adding together each country’s outputs are as follows:
Thus, the total output of plums before the trade was 50 million bushels.
After the specialization by New Zealand in the production of apples, the total output of apples increased to 60 million bushels. Similarly, the specialization by Spain in the production of plums increased the total output of plums to 60 million bushels. Thus, total
Thus, the total output gain of apples is 20 million bushels.
Similarly, the total output gain in the case of plums can be calculated as follows:
Thus, the total output gain in plums is 10 million bushels.
Concept introduction:
Comparative advantage: It is the ability of the producer, firm or a country to produce a good or service at the lowest opportunity cost of production than the competitors.
Specialization: It is the process of identifying the product in which, the country has the comparative advantage in the form of lower opportunity cost of production. Thus, they can focus on the production of that commodity which will increase the output and they can engage in an international exchange in order to obtain the products in which they don’t have any comparative advantage.
Want to see more full solutions like this?
Chapter 26 Solutions
EBK MICROECONOMICS

- Problem 1-Experiments/Randomized Control TrialSuppose you are interested in studying the effect of being a part of the labor union on anindividual’s hourly wage.You collect data on 1000 people and run the following regression. where is a dummy variable which is equal t to 1 for people who are a part of labor union and0 for others. a. Suppose you estimate . Interpret b. Do you think is biased or unbiased? Explain. Now suppose you conduct a randomized control trial to answer the same question. Yourandomly assign some individuals to be a part of the labor union and others to not be a partof the labor union. The first step you take is to ensure that the randomization was donecorrectly. Then you estimate the following equation: =1 if the student is assigned to be a part of Labor Union=0 if the student is assigned to not be a part of Labor Union c. Why is it important to ensure that the randomization is done correctly? d. Name any two variables that you can use to test if Treatment and…arrow_forwardWhat is kiosk?arrow_forwardIf food is produced in the U.S., sold in the U.S. and consumed in the U.S., a reduction in its price will have which of the following effects ______? Two of the answers are correct. The consumer price index will decrease. None of the answers are correct. The GDP deflator will decrease.arrow_forward
- how to caculate verible cost?arrow_forwardWhat is the deficit?arrow_forwardIdentify the two curves shown on the graph, and explain their upward and downward slopes. Why does curve Aintersect the horizontal axis? What is the significance of quantity d? What does erepresent? How would the optimal quantity of information change if the marginal benefit of information increased—that is, if the marginal benefit curve shifted upward?arrow_forward
- 6. Rent seeking The following graph shows the demand, marginal revenue, and marginal cost curves for a single-price monopolist that produces a drug that helps relieve arthritis pain. Place the grey point (star symbol) in the appropriate location on the graph to indicate the monopoly outcome such that the dashed lines reveal the profit-maximizing price and quantity of a single-price monopolist. Then, use the green rectangle (triangle symbols) to show the profits earned by the monopolist. 18 200 20 16 16 14 PRICE (Dollars per dose) 12 10 10 8 4 2 MC = ATC MR Demand 0 0 5 10 15 20 25 30 35 40 45 50 QUANTITY (Millions of doses per year) Monopoly Outcome Monopoly Profits Suppose that should the patent on this particular drug expire, the market would become perfectly competitive, with new firms immediately entering the market with essentially identical products. Further suppose that in this case the original firm will hire lobbyists and make donations to several key politicians to extend its…arrow_forwardConsider a call option on a stock that does not pay dividends. The stock price is $100 per share, and the risk-free interest rate is 10%. The call strike is $100 (at the money). The stock moves randomly with u=2 and d=0.5. 1. Write the system of equations to replicate the option using A shares and B bonds. 2. Solve the system of equations and determine the number of shares and the number of bonds needed to replicate the option. Show your answer with 4 decimal places (x.xxxx); do not round intermediate calculations. This is easy to do in Excel. A = B = 3. Use A shares and B bonds from the prior question to calculate the premium on the option. Again, do not round intermediate calculations and show your answer with 4 decimal places. Call premium =arrow_forwardAnswer these questions using replication or the risk neutral probability. Both methods will produce the same answer. Show your work to receive credit. 6. What is the premium of a call with a higher strike. Show your work to receive credit; do not round intermediate calculations. S0 = $100, u=2, d=0.5, r=10%, strike=$150arrow_forward
- Answer these questions using replication or the risk neutral probability. Both methods will produce the same answer.arrow_forwardProblem 2: At a raffle, 2000 tickets are sold at $5 each for five prizes of $2000, $1000, $500, $250, and $100. You buy one ticket. What is the expected value of your gain? 1. Find the gain for each prize. 2. Write a probability distribution for the possible gains. 3. Find the expected value. 4. Interpret the results.arrow_forwardThis activity focuses on developing direct and supported opinions using various sources of information on the importance of the following topics: non-renewable and renewable energies, economic factors and obstacles that can affect the relationship between international trade and economic growth, devaluation of the currency in countries, and the imbalance of economic equity. In this context, it is essential that, when studying and developing these topics, students understand the concepts of the value of currencies and that leads to devaluation, non-renewable and renewable energy resources, economic development and obstacles, distribution of wealth, economic growth and external and internal constraints, and about international trade as a growth factor. Thus, the objectives that are intended to be achieved are the following: Acquire knowledge about the concepts mentioned above. Determine relationships between economic growth and international trade. Understand what some limitations that…arrow_forward

 Principles of Economics (12th Edition)EconomicsISBN:9780134078779Author:Karl E. Case, Ray C. Fair, Sharon E. OsterPublisher:PEARSON
 Engineering Economy (17th Edition)EconomicsISBN:9780134870069Author:William G. Sullivan, Elin M. Wicks, C. Patrick KoellingPublisher:PEARSON
 Principles of Economics (MindTap Course List)EconomicsISBN:9781305585126Author:N. Gregory MankiwPublisher:Cengage Learning
 Managerial Economics: A Problem Solving ApproachEconomicsISBN:9781337106665Author:Luke M. Froeb, Brian T. McCann, Michael R. Ward, Mike ShorPublisher:Cengage Learning
 Managerial Economics & Business Strategy (Mcgraw-...EconomicsISBN:9781259290619Author:Michael Baye, Jeff PrincePublisher:McGraw-Hill Education