
Videos
1.
Cash payback method:
Cash payback period is the expected time period which is required to recover the cost of investment. It is one of the capital investment method used by the management to evaluate the long-term investment (fixed assets) of the business.
Average
Average rate of return is the amount of income which is earned over the life of the investment. It is used to measure the average income as a percent of the average investment of the business, and it is also known as the accounting rate of return.
The average rate of return is computed as follows:
Net present value method is the method which is used to compare the initial
Present value index:
Present value index is a technique, which is used to rank the proposals of the business. It is used by the management when the business has more investment proposals, and limited fund.
The present value index is computed as follows:
The cash payback period for the given proposals.
1.
Explanation of Solution
The cash payback period for the given proposals is as follows:
Proposal A:
Initial investment=$680,000
| Cash payback period of Proposal A | ||||
| Year | Net cash flows | Cumulative net cash flows | ||
| 1 | 200,000 | 200,000 | ||
| 2 | 200,000 | 400,000 | ||
| 3 | 200,000 | 600,000 | ||
| 6 months (1) | 80,000 | 680,000 | ||
Table (1)
Hence, the cash payback period of proposal A is 3 years and 6 months.
Working note:
1. Calculate the no. of months in the cash payback period:
Proposal B:
Initial investment=$320,000
| Cash payback period of Proposal B | ||||
| Year | Net cash flows | Cumulative net cash flows | ||
| 1 | 90,000 | 90,000 | ||
| 2 | 90,000 | 180,000 | ||
| 3 | 70,000 | 250,000 | ||
| 4 | 70,000 | 320,000 | ||
Table (2)
Hence, the cash payback period of proposal B is 4 years.
Proposal C:
Initial investment=$108,000
| Cash payback period of Proposal C | ||||
| Year | Net cash flows | Cumulative net cash flows | ||
| 1 | 55,000 | 55,000 | ||
| 2 | 53,000 | 108,000 | ||
Table (3)
Hence, the cash payback period of proposal C is 2 years.
Proposal D:
Initial investment=$400,000
| Cash payback period of Proposal D | ||||
| Year | Net cash flows | Cumulative net cash flows | ||
| 1 | 180,000 | 180,000 | ||
| 2 | 180,000 | 360,000 | ||
| 3 months (2) | 40,000 | 400,000 | ||
Table (4)
Hence, the cash payback period of proposal D is 2 years and 3 months.
Working note:
2. Calculate the no. of months in the cash payback period:
2.
The average rate of return for the give proposals.
2.
Explanation of Solution
The average rate of return for the given proposals is as follows:
Proposal A:
Hence, the average rate of return for Proposal A is 14.1%.
Proposal B:
Hence, the average rate of return for Proposal B is 2.5%.
Proposal C:
Hence, the average rate of return for Proposal C is 52.6%.
Proposal D:
Hence, the average rate of return for Proposal D is 30.0%.
3.
To indicate: The proposals which should be accepted for further analysis, and which should be rejected.
3.
Explanation of Solution
The proposals which should be accepted for further analysis, and which should be rejected is as follows:
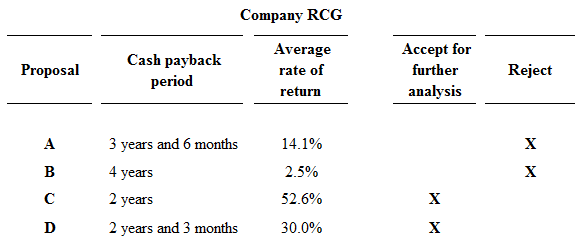
Figure (1)
Proposals A and B are rejected, because proposal A and B fails to meet the required maximum cash back period of 3 years, and they has less rate of return than the other proposals. Hence, Proposals C and D are preferable.
4.
The net present value of preferred proposals.
4.
Explanation of Solution
Calculate the net present value of the proposals which has 12% rate of return as follows:
Proposal C:
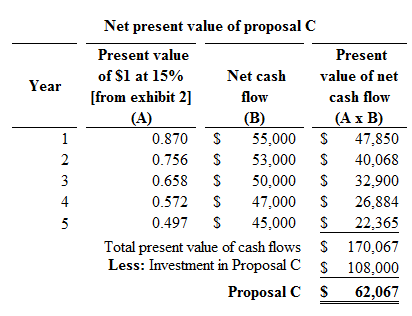
Figure (2)
Hence, the net present value of proposal C is $62,067.
Proposal D:
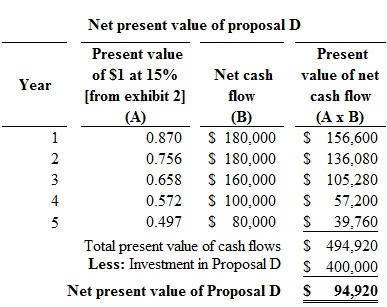
Figure (3)
Hence, the net present value of proposal D is $94,920.
5.
To determine: The present value index for each proposal.
5.
Explanation of Solution
The present value index for each proposal is as follows:
Proposal C:
Calculate the present value index for proposal C:
Hence, the present value index for proposal C is 1.575.
Proposal D:
Calculate the present value index for proposal D:
Hence, the present value index for proposal D is 1.237.
6.
To rank: The proposal from most attractive to least attractive, based on the present value of net cash flows.
6.
Explanation of Solution
Proposals are arranged by rank is as follows:
| Proposals | Net present value | Rank |
| Proposal D | $ 94,920 | 1 |
| Proposal C | $ 62,067 | 2 |
Table (5)
7.
To rank: The proposal from most attractive to least attractive, based on the present value of index.
7.
Explanation of Solution
Proposals are arranged by rank is as follows:
| Proposals | Present value index | Rank |
| Proposal C | 1.57 | 1 |
| Proposal D | 1.24 | 2 |
Table (6)
8.
To analysis: The proposal which is favor to investment, and comment on the relative attractiveness of the proposals based on the rank.
8.
Explanation of Solution
On the basis of net present value:
The net present value of Proposal C is $62,067, and Proposal D is $94,920. In this case, the net present value of proposal D is more than the net present value of proposal C. Hence, investment in Proposal D is preferable.
On the basis of present value index:
The present value index of Proposal C is 1.57, and the present value index of Proposal D is 1.24. In this case, Proposal C has the favorable present value index, because the present value index of Proposal C (1.57) is more than Proposal D (1.24). Thus, the investment in Proposal C is preferable (favorable).
Every business tries to get maximum profit with minimum investment. Hence, the cost of investment in Proposal C is less than the proposal D. Thus, investment in Proposal C is preferable.
Want to see more full solutions like this?
Chapter 25 Solutions
Financial & Managerial Accounting 14th Ed. W/ PAC LMS Intg CNOWv2 2S


 Managerial AccountingAccountingISBN:9781337912020Author:Carl Warren, Ph.d. Cma William B. TaylerPublisher:South-Western College Pub
 Financial And Managerial AccountingAccountingISBN:9781337902663Author:WARREN, Carl S.Publisher:Cengage Learning,
 Survey of Accounting (Accounting I)AccountingISBN:9781305961883Author:Carl WarrenPublisher:Cengage Learning
 EBK CONTEMPORARY FINANCIAL MANAGEMENTFinanceISBN:9781337514835Author:MOYERPublisher:CENGAGE LEARNING - CONSIGNMENT
 Principles of Accounting Volume 2AccountingISBN:9781947172609Author:OpenStaxPublisher:OpenStax College
 Intermediate Financial Management (MindTap Course...FinanceISBN:9781337395083Author:Eugene F. Brigham, Phillip R. DavesPublisher:Cengage Learning