
(a)
To plot the data and obtain the equation of the least squares regression line expressing width as a fraction of length.
(a)
Answer to Problem 25.13CRE
The regression equation is:
Explanation of Solution
In the question we have given the data in a table on the size of perch in a lake in Finland. Here we have to examine the relationship between width (y) and length (x) in perch. Thus, we have selected the data of the table and using excel we have constructed a
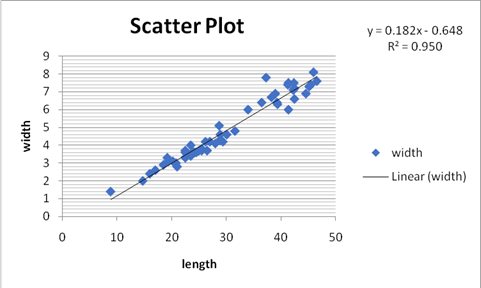
Here the length is on the horizontal line and width is on the vertical line. Thus, from this we can say that the relationship between width (y) and length (x) in perch is linear as the points are near to each other and positive in nature as they are moving in upward direction. Also, from the scatterplot, the equation of the least squares regression line expressing width as a fraction of length is as:
(b)
To find out how well can we predict the width of a perch from its length.
(b)
Explanation of Solution
In the question we have given the data in a table on the size of perch in a lake in Finland. Here we have to examine the relationship between width (y) and length (x) in perch. And, the equation of the least squares regression line expressing width as a fraction of length is as:
Since the
(c)
To predict the mean width of such fish and give a
(c)
Answer to Problem 25.13CRE
The mean of the width of fish is
Explanation of Solution
In the question we have given the data in a table on the size of perch in a lake in Finland. Here we have to examine the relationship between width (y) and length (x) in perch. And, the equation of the least squares regression line expressing width as a fraction of length is as:
It is given that the length of a typical perch is about
And the
| Coefficients | Standard Error | t Stat | P-value | Lower 95% | Upper 95% | |
| Intercept | -0.648744077 | 0.175139507 | -3.704156116 | 0.000500034 | -0.999877647 | -0.297610506 |
| length | 0.182225914 | 0.005642218 | 32.29685578 | 5.40028E-37 | 0.170913947 | 0.193537881 |
Thus, the confidence interval is:
(d)
To examine the residual and explain does fish number
(d)
Answer to Problem 25.13CRE
Yes, the fish number
Explanation of Solution
In the question we have given the data in a table on the size of perch in a lake in Finland. Here we have to examine the relationship between width (y) and length (x) in perch. And, the equation of the least squares regression line expressing width as a fraction of length is as:
For analyzing the residual, we will use excel. First go to the data tab and select the data analysis option. The dialogue box will appear and then select the regression from it click OK. Then another dialogue box will appear in which insert the data values and then the regression plot will appear as:
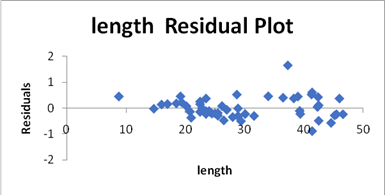
We can see from the residual plot that the points are near to each other but at the end they are more scattered and from this we can we that the fish number
Want to see more full solutions like this?
Chapter 25 Solutions
PRACT. OF STAT. IN LIFE SCI.W/ACHIEVE 1

- 2. [20] Let {X1,..., Xn} be a random sample from Ber(p), where p = (0, 1). Consider two estimators of the parameter p: 1 p=X_and_p= n+2 (x+1). For each of p and p, find the bias and MSE.arrow_forward1. [20] The joint PDF of RVs X and Y is given by xe-(z+y), r>0, y > 0, fx,y(x, y) = 0, otherwise. (a) Find P(0X≤1, 1arrow_forward4. [20] Let {X1,..., X} be a random sample from a continuous distribution with PDF f(x; 0) = { Axe 5 0, x > 0, otherwise. where > 0 is an unknown parameter. Let {x1,...,xn} be an observed sample. (a) Find the value of c in the PDF. (b) Find the likelihood function of 0. (c) Find the MLE, Ô, of 0. (d) Find the bias and MSE of 0.arrow_forward3. [20] Let {X1,..., Xn} be a random sample from a binomial distribution Bin(30, p), where p (0, 1) is unknown. Let {x1,...,xn} be an observed sample. (a) Find the likelihood function of p. (b) Find the MLE, p, of p. (c) Find the bias and MSE of p.arrow_forwardGiven the sample space: ΩΞ = {a,b,c,d,e,f} and events: {a,b,e,f} A = {a, b, c, d}, B = {c, d, e, f}, and C = {a, b, e, f} For parts a-c: determine the outcomes in each of the provided sets. Use proper set notation. a. (ACB) C (AN (BUC) C) U (AN (BUC)) AC UBC UCC b. C. d. If the outcomes in 2 are equally likely, calculate P(AN BNC).arrow_forwardSuppose a sample of O-rings was obtained and the wall thickness (in inches) of each was recorded. Use a normal probability plot to assess whether the sample data could have come from a population that is normally distributed. Click here to view the table of critical values for normal probability plots. Click here to view page 1 of the standard normal distribution table. Click here to view page 2 of the standard normal distribution table. 0.191 0.186 0.201 0.2005 0.203 0.210 0.234 0.248 0.260 0.273 0.281 0.290 0.305 0.310 0.308 0.311 Using the correlation coefficient of the normal probability plot, is it reasonable to conclude that the population is normally distributed? Select the correct choice below and fill in the answer boxes within your choice. (Round to three decimal places as needed.) ○ A. Yes. The correlation between the expected z-scores and the observed data, , exceeds the critical value, . Therefore, it is reasonable to conclude that the data come from a normal population. ○…arrow_forwardding question ypothesis at a=0.01 and at a = 37. Consider the following hypotheses: 20 Ho: μ=12 HA: μ12 Find the p-value for this hypothesis test based on the following sample information. a. x=11; s= 3.2; n = 36 b. x = 13; s=3.2; n = 36 C. c. d. x = 11; s= 2.8; n=36 x = 11; s= 2.8; n = 49arrow_forward13. A pharmaceutical company has developed a new drug for depression. There is a concern, however, that the drug also raises the blood pressure of its users. A researcher wants to conduct a test to validate this claim. Would the manager of the pharmaceutical company be more concerned about a Type I error or a Type II error? Explain.arrow_forwardFind the z score that corresponds to the given area 30% below z.arrow_forwardFind the following probability P(z<-.24)arrow_forward3. Explain why the following statements are not correct. a. "With my methodological approach, I can reduce the Type I error with the given sample information without changing the Type II error." b. "I have already decided how much of the Type I error I am going to allow. A bigger sample will not change either the Type I or Type II error." C. "I can reduce the Type II error by making it difficult to reject the null hypothesis." d. "By making it easy to reject the null hypothesis, I am reducing the Type I error."arrow_forwardGiven the following sample data values: 7, 12, 15, 9, 15, 13, 12, 10, 18,12 Find the following: a) Σ x= b) x² = c) x = n d) Median = e) Midrange x = (Enter a whole number) (Enter a whole number) (use one decimal place accuracy) (use one decimal place accuracy) (use one decimal place accuracy) f) the range= g) the variance, s² (Enter a whole number) f) Standard Deviation, s = (use one decimal place accuracy) Use the formula s² ·Σx² -(x)² n(n-1) nΣ x²-(x)² 2 Use the formula s = n(n-1) (use one decimal place accuracy)arrow_forwardarrow_back_iosSEE MORE QUESTIONSarrow_forward_ios
 MATLAB: An Introduction with ApplicationsStatisticsISBN:9781119256830Author:Amos GilatPublisher:John Wiley & Sons Inc
 Probability and Statistics for Engineering and th...StatisticsISBN:9781305251809Author:Jay L. DevorePublisher:Cengage Learning
 Statistics for The Behavioral Sciences (MindTap C...StatisticsISBN:9781305504912Author:Frederick J Gravetter, Larry B. WallnauPublisher:Cengage Learning
 Elementary Statistics: Picturing the World (7th E...StatisticsISBN:9780134683416Author:Ron Larson, Betsy FarberPublisher:PEARSON
 The Basic Practice of StatisticsStatisticsISBN:9781319042578Author:David S. Moore, William I. Notz, Michael A. FlignerPublisher:W. H. Freeman
 Introduction to the Practice of StatisticsStatisticsISBN:9781319013387Author:David S. Moore, George P. McCabe, Bruce A. CraigPublisher:W. H. Freeman