
Concept explainers
Videos
a.
Identify the null hypothesis and alternative hypothesis.
a.
Answer to Problem 1E
Null hypothesis:
Alternative hypothesis:
Explanation of Solution
The given information is that, a student conducted an experiment to identify whether there is any significant difference in the four popcorn brands. The number of kernels which was left unpopped, were also recorded. The student measured pops of each brand four times. The F-ratio obtained from the test is 13.56.
Let
The null hypothesis is framed by assuming that all the four brands of popcorn results in the same mean number of unpopped kernels.
Null hypothesis:
The mean number of unpopped kernels obtained from each of the four brands of popcorn is the same.
Alternative hypothesis:
The mean number of unpopped kernels obtained at least one of the brand is different from the rest of the brands.
b.
Find the degrees of freedom for the treatment sum of squares and the error sum of squares.
b.
Answer to Problem 1E
The degrees of freedom for the treatment sum of squares is 3.
The degrees of freedom for the error sum of squares is 12.
Explanation of Solution
Calculation:
Degrees of freedom for treatment sum of squares:
If there are k treatments them the degrees of freedom for the treatment sum of squares is
Here, there are four brands (treatments), then the degrees of freedom is,
Substitute k as 4 in
Thus,
Thus, the degrees of freedom for the treatment sum of squares is 3.
Degrees of freedom for the error sum of squares:
The error sum of squares for the experiment with N observations and having k treatments is
There are four brands of treatments and each treatment is applied four times. Hence, there will be
Then the degrees of freedom is,
Substitute N as 16 and k as 4 in
Thus,
Thus, the degrees of freedom for the error sum of squares is 12.
c.
Find the P-value and give conclusion.
c.
Answer to Problem 1E
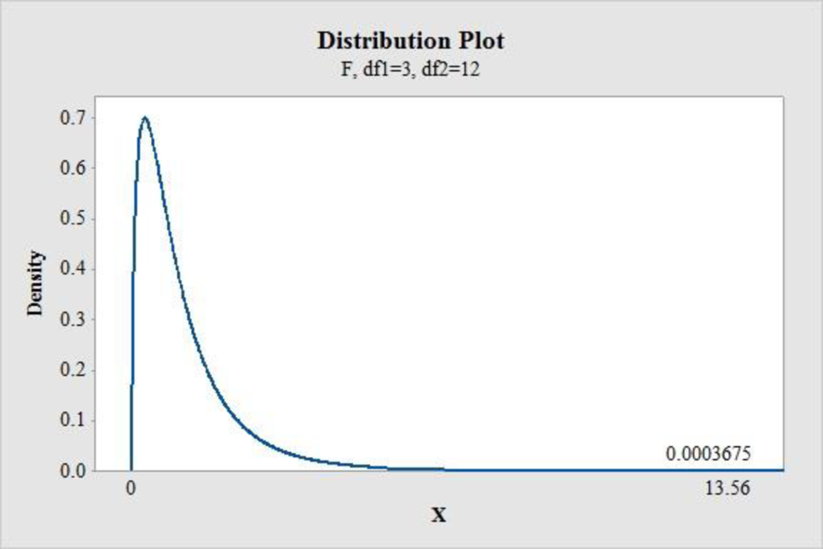
The P-value is 0.00037.
There is strong evidence to conclude that the mean number of un popped kernels is different for at least one of the four brands of popcorn.
Explanation of Solution
Calculation:
The given information is that, assume all the required conditions for ANOVA were satisfied.
The P-value is calculated as follows:
Software procedure:
Step by step procedure to find the P-value using MINITBA is given below:
- Choose Graph > Probability Distribution Plot > choose View Probability> OK.
- From Distribution, choose F.
- Enter Numerator df as 3 and Denominator df as 12.
- Under Shaded Area tab, select X Value and choose Right Tail.
- Enter the X Value as 13.56.
- Click OK.
Output obtained from MINITAB is given below:
Conclusion:
The P-value for the F-statistic is 0.00037 and the level of significance is 0.01.
The P-value is less than the level of significance.
That is,
Thus, there is strong evidence to conclude that the mean number of unpopped kernels is different for at least one of the four brands of popcorn.
d.
Suggest what else about the data would be useful to check the assumptions and conditions.
d.
Explanation of Solution
The side by side boxplot of the treatments would be useful to check the similar variance conditions and also the spread of the data.
The normal probability of residuals can be used to check the normality assumption of the error term. If the points in the normal probability plot lies approximately on a straight line it assumed that the residuals are
Also, residual plot is used to identify pattern and spread of the residuals.
Want to see more full solutions like this?
Chapter 25 Solutions
STATS:DATA+MODELS-MY LAB ACC >CUSTOM<


- Using the toddler data table in Question 1, describe the toddlers in the sample with joint probabilities only. (300) B(K)-00+300 501 30 smot dbabib (oor de leng 001-009:(00s) 200, yoogie Fox (D) ed to diman edarrow_forwardRight-Handed Left-Handed 24 Gender Males 4 Females 2 12arrow_forwardappropriate probabilities. 19 Using the data from Table 17-1, are gender and political party independent for this group? nis cow sib signia si Falows grillor le pussarrow_forward
- 11 Using the same toddler data, describe the toddlers with marginal probabilities only. BAY bit of benoliesmas (89 abje' jook stages of te cojota ing ou an out of to cojota ovig ber el ba 3+4=029arrow_forward21 Using the data from the table in Question 1, does the dominant hand differ for male toddlers versus female toddlers? (In other words, are these two events dependent?)arrow_forwardop In a two-way table with variables A and B, does P(A|B) + P(A|B) = 1? பே 69 6 work as m 3 atavs ow to portabagabat sot gaisarrow_forward
- In a two-way table with variables A and B, does P(A|B)+P(A|B)=1? dsins/Ispino936) 1 durab ALED a to gilidadost Earrow_forwardpreference are dependent (you even have to look at the males). Using the bumper sticker data in the first example problem in this chapter, are car age and number of bumper stickers related (In other words, are these two events dependent?) d insbusqabni oss agit ads bms gliw woy tadi validadong ada 15W wex s m ad ow MP gliw Boy 1st yilidadong at al terW .d Shsed smo viaxe 5X9 of pe 012 from 12 or to HOM qose Aunt swam to prepants M&arrow_forward23 வ dous biops Which marginal probabilities that you find in a two-way table should sum to 1? 著arrow_forward
- Using the toddler data from the table in Question 1 and appropriate probability notation, do the following: a. Compare the right-handed female and male toddlers in the sample, using condi- tional probabilities (only). b. Compare the right-handed toddlers asid in the sample, using conditional probabilities (only).dependent abni sis & bas bax bensqged snavs med) galworl andarrow_forwardUsing the toddler data from the table in Question 1 and appropriate probability notation, identify and calculate the following: a. What percentage of the male toddlers are right-handed? te b. What percentage of the female toddlers are right-handed? c. What percentage of the right-handed toddlers are male? d. What percentage of the right-handed toddlers are female?arrow_forward10 Using the toddler data from the table in Question 1 and the appropriate probability Tonotation, identify and calculate ther s following: a. What percentage of the toddlers are right-handed? b. now to What percentage of the toddlers are female? female? da boit vom wo c. What proportion of the toddlers are left-handed? d. What's the chance of finding a male toddler from the sample? [10arrow_forward
 MATLAB: An Introduction with ApplicationsStatisticsISBN:9781119256830Author:Amos GilatPublisher:John Wiley & Sons Inc
 Probability and Statistics for Engineering and th...StatisticsISBN:9781305251809Author:Jay L. DevorePublisher:Cengage Learning
 Statistics for The Behavioral Sciences (MindTap C...StatisticsISBN:9781305504912Author:Frederick J Gravetter, Larry B. WallnauPublisher:Cengage Learning
 Elementary Statistics: Picturing the World (7th E...StatisticsISBN:9780134683416Author:Ron Larson, Betsy FarberPublisher:PEARSON
 The Basic Practice of StatisticsStatisticsISBN:9781319042578Author:David S. Moore, William I. Notz, Michael A. FlignerPublisher:W. H. Freeman
 Introduction to the Practice of StatisticsStatisticsISBN:9781319013387Author:David S. Moore, George P. McCabe, Bruce A. CraigPublisher:W. H. Freeman