
Statistics: The Art and Science of Learning From Data, Books a la Carte Edition (4th Edition)
4th Edition
ISBN: 9780133860825
Author: Alan Agresti, Christine A. Franklin, Bernhard Klingenberg
Publisher: PEARSON
expand_more
expand_more
format_list_bulleted
Concept explainers
Videos
Textbook Question
Chapter 2.4, Problem 56PB
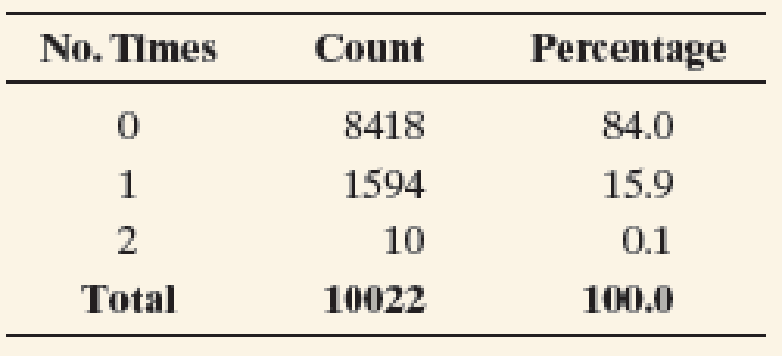
- a. Verify that the
mean number of times men have been married is 0.16 and that the standard deviation is 0.37. - b. Find the actual percentages of observations within 1, 2, and 3 standard deviations of the mean. How do these compare to the percentages predicted by the empirical rule?
- c. How do you explain the results in part b?
Expert Solution & Answer
Want to see the full answer?
Check out a sample textbook solution
Students have asked these similar questions
A researcher wishes to estimate, with 90% confidence, the population proportion of adults who support labeling
legislation for genetically modified organisms (GMOs). Her estimate must be accurate within 4% of the true proportion.
(a) No preliminary estimate is available. Find the minimum sample size needed.
(b) Find the minimum sample size needed, using a prior study that found that 65% of the respondents said they support
labeling legislation for GMOs.
(c) Compare the results from parts (a) and (b).
...
(a) What is the minimum sample size needed assuming that no prior information is available?
n =
(Round up to the nearest whole number as needed.)
The table available below shows the costs per mile (in cents) for a sample of automobiles. At a = 0.05, can you conclude that at least one mean
cost per mile is different from the others?
Click on the icon to view the data table.
Let Hss, HMS, HLS, Hsuv and Hмy represent the mean costs per mile for small sedans, medium sedans, large sedans, SUV 4WDs, and minivans
respectively. What are the hypotheses for this test?
OA. Ho: Not all the means are equal.
Ha Hss HMS HLS HSUV HMV
B. Ho Hss HMS HLS HSUV = μMV
Ha: Hss *HMS *HLS*HSUV * HMV
C. Ho Hss HMS HLS HSUV =μMV
= =
H: Not all the means are equal.
D. Ho Hss HMS
HLS HSUV HMV
Ha Hss HMS
HLS =HSUV = HMV
Question: A company launches two different marketing campaigns to promote the same product in two different regions. After one month, the company collects the sales data (in units sold) from both regions to compare the effectiveness of the campaigns.
The company wants to determine whether there is a significant difference in the mean sales between the two regions. Perform a two sample T-test
You can provide your answer by inserting a text box and the answer must include:
Null hypothesis,
Alternative hypothesis,
Show answer (output table/summary table), and
Conclusion based on the P value.
(2 points = 0.5 x 4 Answers)
Each of these is worth 0.5 points. However, showing the calculation is must. If calculation is missing, the whole answer won't get any credit.
Chapter 2 Solutions
Statistics: The Art and Science of Learning From Data, Books a la Carte Edition (4th Edition)
Ch. 2.1 - Categorical/quantitative difference a. Explain the...Ch. 2.1 - U.S. married-couple households According to a...Ch. 2.1 - Identify the variable type Identify each of the...Ch. 2.1 - Categorical or quantitative? Identify each of the...Ch. 2.1 - Discrete/continuous a. Explain the difference...Ch. 2.1 - Discrete or continuous? Identify each of the...Ch. 2.1 - Discrete or continuous 2 Repeat the previous...Ch. 2.1 - Prob. 8PBCh. 2.1 - Fatal Shark Attacks Few of the shark attacks...Ch. 2.2 - Generating Electricity In 2012 in the United...
Ch. 2.2 - What do alligators eat? The bar chart is from a...Ch. 2.2 - Prob. 12PBCh. 2.2 - Prob. 13PBCh. 2.2 - Prob. 14PBCh. 2.2 - Sugar dot plot For the breakfast cereal data given...Ch. 2.2 - Prob. 16PBCh. 2.2 - Graphing exam scores A teacher shows her class the...Ch. 2.2 - Fertility rates The fertility rate for a nation is...Ch. 2.2 - Split Stems The figure below shows the...Ch. 2.2 - Histogram for sugar For the breakfast cereal data,...Ch. 2.2 - Prob. 21PBCh. 2.2 - Prob. 22PBCh. 2.2 - Prob. 23PBCh. 2.2 - Prob. 24PBCh. 2.2 - Prob. 25PBCh. 2.2 - Prob. 26PBCh. 2.2 - Prob. 27PBCh. 2.2 - Warming in Newnan, Georgia? Access the Newnan, GA...Ch. 2.3 - Median versus mean For each of the following...Ch. 2.3 - Prob. 30PBCh. 2.3 - Prob. 31PBCh. 2.3 - Resistance to an outlier Consider the following...Ch. 2.3 - Income and health insurance According to the U.S....Ch. 2.3 - Prob. 34PBCh. 2.3 - Prob. 35PBCh. 2.3 - Prob. 36PBCh. 2.3 - Public transportationcenter The owner of a company...Ch. 2.3 - Prob. 38PBCh. 2.3 - Prob. 39PBCh. 2.3 - European fertility The European fertility rates...Ch. 2.3 - Sex partners A recent General Social Survey asked...Ch. 2.3 - Prob. 43PBCh. 2.3 - Prob. 44PBCh. 2.3 - Prob. 45PBCh. 2.4 - Sick leave A company decides to investigate the...Ch. 2.4 - Prob. 47PBCh. 2.4 - Prob. 48PBCh. 2.4 - Prob. 49PBCh. 2.4 - Exam standard deviation For an exam given to a...Ch. 2.4 - Heights For the sample heights of Georgia college...Ch. 2.4 - Histograms and standard deviation The figure shows...Ch. 2.4 - Female strength The High School Female Athletes...Ch. 2.4 - Female body weight The College Athletes data file...Ch. 2.4 - Shape of cigarette taxes A recent summary for the...Ch. 2.4 - Empirical rule and skewed, highly discrete...Ch. 2.4 - How much TV? The 2012 General Social Survey asked,...Ch. 2.4 - How many friends? A recent General Social Survey...Ch. 2.4 - Judging skew using x and s If the largest...Ch. 2.4 - Youth unemployment in the EU The Youth...Ch. 2.4 - Create data with a given standard deviation Use...Ch. 2.5 - Vacation days National Geographic Traveler...Ch. 2.5 - Youth unemployment In recent years, many European...Ch. 2.5 - Female strength The High School Female Athletes...Ch. 2.5 - Female body weight The College Athletes data file...Ch. 2.5 - Ways to measure variability The standard...Ch. 2.5 - Variability of cigarette taxes Heres the...Ch. 2.5 - Prob. 68PBCh. 2.5 - Infant mortality Africa The Human Development...Ch. 2.5 - Prob. 70PBCh. 2.5 - Computer use During a recent semester at the...Ch. 2.5 - Central Park temperature distribution revisited...Ch. 2.5 - Box plot for exam The scores on an exam have mean...Ch. 2.5 - Public transportation Exercise 2.37 described a...Ch. 2.5 - Prob. 75PBCh. 2.5 - Prob. 76PBCh. 2.5 - Prob. 77PBCh. 2.5 - Prob. 78PBCh. 2.5 - Prob. 79PBCh. 2.5 - Prob. 80PBCh. 2.5 - Prob. 81PBCh. 2.5 - Prob. 82PBCh. 2.6 - Great pay (on the average) The six full-time...Ch. 2.6 - Prob. 84PBCh. 2.6 - Prob. 85PBCh. 2.6 - Terrorism and war in Iraq In 2004, a college...Ch. 2.6 - Prob. 87PBCh. 2.6 - Prob. 88PBCh. 2 - Categorical or quantitative? Identify each of the...Ch. 2 - Continuous or discrete? Which of the following...Ch. 2 - Prob. 92CPCh. 2 - Cool in China A recent survey8 asked 1200...Ch. 2 - Prob. 94CPCh. 2 - Prob. 95CPCh. 2 - Prob. 96CPCh. 2 - Prob. 97CPCh. 2 - Prob. 98CPCh. 2 - Prob. 99CPCh. 2 - Prob. 100CPCh. 2 - Prob. 101CPCh. 2 - Prob. 103CPCh. 2 - Household net worth A study reported that in 2007...Ch. 2 - Prob. 105CPCh. 2 - Prob. 106CPCh. 2 - Prob. 107CPCh. 2 - Central Park monthly temperatures The MINITAB...Ch. 2 - Prob. 109CPCh. 2 - Female heights According to a recent report from...Ch. 2 - Energy and water consumption In parts a and b,...Ch. 2 - Prob. 112CPCh. 2 - More hurricane damage Refer to the previous...Ch. 2 - Prob. 114CPCh. 2 - Prob. 115CPCh. 2 - Prob. 116CPCh. 2 - Prob. 117CPCh. 2 - Temperatures in Central Park Access the Central...Ch. 2 - Teachers salaries According to Statistical...Ch. 2 - Prob. 120CPCh. 2 - What box plot do you expect? For each of the...Ch. 2 - Prob. 122CPCh. 2 - Prob. 123CPCh. 2 - Prob. 124CPCh. 2 - Prob. 125CPCh. 2 - Who was Roger Maris? Roger Maris, who spent most...Ch. 2 - Baseballs great home run hitters The Baseballs HR...Ch. 2 - Prob. 128CPCh. 2 - Controlling asthma A study of 13 children...Ch. 2 - Prob. 130CPCh. 2 - Youth unemployment by gender The side-by-side box...Ch. 2 - You give examples Give an example of a variable...Ch. 2 - Political conservatism and liberalism Where do...Ch. 2 - Mode but not median and mean The previous exercise...Ch. 2 - Multiple choice: GRE scores In a study of graduate...Ch. 2 - Multiple choice: Fact about s Which statement...Ch. 2 - Prob. 137CPCh. 2 - True or false: a. The mean, median, and mode can...Ch. 2 - Bad statistic A teacher summarizes grades on an...Ch. 2 - True or false: Soccer According to a story in the...Ch. 2 - Mean for grouped data Refer to the calculation of...Ch. 2 - Prob. 142CPCh. 2 - Range and standard deviation approximation Use the...Ch. 2 - Range the least resistant Weve seen that measures...Ch. 2 - Using MAD to measure variability The standard...Ch. 2 - Prob. 146CPCh. 2 - Create own data For the Mean Versus Median web...
Knowledge Booster


Learn more about
Need a deep-dive on the concept behind this application? Look no further. Learn more about this topic, statistics and related others by exploring similar questions and additional content below.Similar questions
- Binomial Prob. Question: A new teaching method claims to improve student engagement. A survey reveals that 60% of students find this method engaging. If 15 students are randomly selected, what is the probability that: a) Exactly 9 students find the method engaging?b) At least 7 students find the method engaging? (2 points = 1 x 2 answers) Provide answers in the yellow cellsarrow_forwardIn a survey of 2273 adults, 739 say they believe in UFOS. Construct a 95% confidence interval for the population proportion of adults who believe in UFOs. A 95% confidence interval for the population proportion is ( ☐, ☐ ). (Round to three decimal places as needed.)arrow_forwardFind the minimum sample size n needed to estimate μ for the given values of c, σ, and E. C=0.98, σ 6.7, and E = 2 Assume that a preliminary sample has at least 30 members. n = (Round up to the nearest whole number.)arrow_forward
- In a survey of 2193 adults in a recent year, 1233 say they have made a New Year's resolution. Construct 90% and 95% confidence intervals for the population proportion. Interpret the results and compare the widths of the confidence intervals. The 90% confidence interval for the population proportion p is (Round to three decimal places as needed.) J.D) .arrow_forwardLet p be the population proportion for the following condition. Find the point estimates for p and q. In a survey of 1143 adults from country A, 317 said that they were not confident that the food they eat in country A is safe. The point estimate for p, p, is (Round to three decimal places as needed.) ...arrow_forward(c) Because logistic regression predicts probabilities of outcomes, observations used to build a logistic regression model need not be independent. A. false: all observations must be independent B. true C. false: only observations with the same outcome need to be independent I ANSWERED: A. false: all observations must be independent. (This was marked wrong but I have no idea why. Isn't this a basic assumption of logistic regression)arrow_forward
- Business discussarrow_forwardSpam filters are built on principles similar to those used in logistic regression. We fit a probability that each message is spam or not spam. We have several variables for each email. Here are a few: to_multiple=1 if there are multiple recipients, winner=1 if the word 'winner' appears in the subject line, format=1 if the email is poorly formatted, re_subj=1 if "re" appears in the subject line. A logistic model was fit to a dataset with the following output: Estimate SE Z Pr(>|Z|) (Intercept) -0.8161 0.086 -9.4895 0 to_multiple -2.5651 0.3052 -8.4047 0 winner 1.5801 0.3156 5.0067 0 format -0.1528 0.1136 -1.3451 0.1786 re_subj -2.8401 0.363 -7.824 0 (a) Write down the model using the coefficients from the model fit.log_odds(spam) = -0.8161 + -2.5651 + to_multiple + 1.5801 winner + -0.1528 format + -2.8401 re_subj(b) Suppose we have an observation where to_multiple=0, winner=1, format=0, and re_subj=0. What is the predicted probability that this message is spam?…arrow_forwardConsider an event X comprised of three outcomes whose probabilities are 9/18, 1/18,and 6/18. Compute the probability of the complement of the event. Question content area bottom Part 1 A.1/2 B.2/18 C.16/18 D.16/3arrow_forward
- John and Mike were offered mints. What is the probability that at least John or Mike would respond favorably? (Hint: Use the classical definition.) Question content area bottom Part 1 A.1/2 B.3/4 C.1/8 D.3/8arrow_forwardThe details of the clock sales at a supermarket for the past 6 weeks are shown in the table below. The time series appears to be relatively stable, without trend, seasonal, or cyclical effects. The simple moving average value of k is set at 2. What is the simple moving average root mean square error? Round to two decimal places. Week Units sold 1 88 2 44 3 54 4 65 5 72 6 85 Question content area bottom Part 1 A. 207.13 B. 20.12 C. 14.39 D. 0.21arrow_forwardThe details of the clock sales at a supermarket for the past 6 weeks are shown in the table below. The time series appears to be relatively stable, without trend, seasonal, or cyclical effects. The simple moving average value of k is set at 2. If the smoothing constant is assumed to be 0.7, and setting F1 and F2=A1, what is the exponential smoothing sales forecast for week 7? Round to the nearest whole number. Week Units sold 1 88 2 44 3 54 4 65 5 72 6 85 Question content area bottom Part 1 A. 80 clocks B. 60 clocks C. 70 clocks D. 50 clocksarrow_forward
arrow_back_ios
SEE MORE QUESTIONS
arrow_forward_ios
Recommended textbooks for you
 Glencoe Algebra 1, Student Edition, 9780079039897...AlgebraISBN:9780079039897Author:CarterPublisher:McGraw Hill
 Big Ideas Math A Bridge To Success Algebra 1: Stu...AlgebraISBN:9781680331141Author:HOUGHTON MIFFLIN HARCOURTPublisher:Houghton Mifflin Harcourt
Glencoe Algebra 1, Student Edition, 9780079039897...
Algebra
ISBN:9780079039897
Author:Carter
Publisher:McGraw Hill
Big Ideas Math A Bridge To Success Algebra 1: Stu...
Algebra
ISBN:9781680331141
Author:HOUGHTON MIFFLIN HARCOURT
Publisher:Houghton Mifflin Harcourt
Bayes' Theorem 1: Introduction and conditional probability; Author: Dr Nic's Maths and Stats;https://www.youtube.com/watch?v=lQVkXfJ-rpU;License: Standard YouTube License, CC-BY
What is Conditional Probability | Bayes Theorem | Conditional Probability Examples & Problems; Author: ACADGILD;https://www.youtube.com/watch?v=MxOny_1y2Q4;License: Standard YouTube License, CC-BY
Bayes' Theorem of Probability With Tree Diagrams & Venn Diagrams; Author: The Organic Chemistry Tutor;https://www.youtube.com/watch?v=OByl4RJxnKA;License: Standard YouTube License, CC-BY
Bayes' Theorem - The Simplest Case; Author: Dr. Trefor Bazett;https://www.youtube.com/watch?v=XQoLVl31ZfQ;License: Standard Youtube License