
Videos
a.
The amount of budget from the given graph.
a.
Explanation of Solution
Given information:
The given graph is shown below.

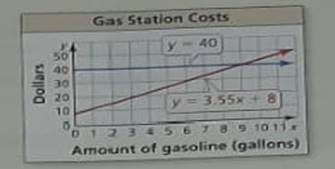
The graph shows the budget and the total cost of
Calculations:
From the given graph it can be easily understood that the budget is
The horizontal line above the X axis shows the budget.
The line
b.
The cost of one gallon of gasoline and a car wash.
b.
Explanation of Solution
Given information:
Given information:
The given graph is shown below.
The graph shows the budget and the total cost of
Calculations:
From the given graph it can be easily understood that the budget is
The horizontal line above the X axis shows the budget.
The line
In the line,
Here,
Also
c.
An inequality that represents the possible amount of gasoline that can be bought.
c.
Explanation of Solution
Given information:
The given graph is shown below.

The graph shows the budget and the total cost of
Calculations:
From the given graph it can be easily understood that the budget is
The horizontal line above the X axis shows the budget.
The line
Now an inequality can be written as, the expenditure should be less than or equal to the budget.
Thus we can write,
d.
The solution of the inequality using the graph.
d.
Explanation of Solution
Given information:
The given graph is shown below.

The graph shows the budget and the total cost of
Calculations:
From the given graph it can be easily understood that the budget is
The horizontal line above the X axis shows the budget.
The line
Now an inequality can be written as, the expenditure should be less than or equal to the budget.
Thus we can write,
Now we solve the inequality.
Thus we can say that a maximum of
Chapter 2 Solutions
Big Ideas Math A Bridge To Success Algebra 1: Student Edition 2015


- For the following exercise, find the domain and range of the function below using interval notation. 10+ 9 8 7 6 5 4 3 2 1 10 -9 -8 -7 -6 -5 -4 -3 -2 -1 2 34 5 6 7 8 9 10 -1 -2 Domain: Range: -4 -5 -6 -7- 67% 9 -8 -9 -10-arrow_forward1. Given that h(t) = -5t + 3 t². A tangent line H to the function h(t) passes through the point (-7, B). a. Determine the value of ẞ. b. Derive an expression to represent the gradient of the tangent line H that is passing through the point (-7. B). c. Hence, derive the straight-line equation of the tangent line H 2. The function p(q) has factors of (q − 3) (2q + 5) (q) for the interval -3≤ q≤ 4. a. Derive an expression for the function p(q). b. Determine the stationary point(s) of the function p(q) c. Classify the stationary point(s) from part b. above. d. Identify the local maximum of the function p(q). e. Identify the global minimum for the function p(q). 3. Given that m(q) = -3e-24-169 +9 (-39-7)(-In (30-755 a. State all the possible rules that should be used to differentiate the function m(q). Next to the rule that has been stated, write the expression(s) of the function m(q) for which that rule will be applied. b. Determine the derivative of m(q)arrow_forwardSafari File Edit View History Bookmarks Window Help Ο Ω OV O mA 0 mW ర Fri Apr 4 1 222 tv A F9 F10 DII 4 F6 F7 F8 7 29 8 00 W E R T Y U S D பட 9 O G H J K E F11 + 11 F12 O P } [arrow_forward
- So confused. Step by step instructions pleasearrow_forwardIn simplest terms, Sketch the graph of the parabola. Then, determine its equation. opens downward, vertex is (- 4, 7), passes through point (0, - 39)arrow_forwardIn simplest way, For each quadratic relation, find the zeros and the maximum or minimum. a) y = x 2 + 16 x + 39 b) y = 5 x2 - 50 x - 120arrow_forward
- In simplest terms and step by step Write each quadratic relation in standard form, then fi nd the zeros. y = - 4( x + 6)2 + 36arrow_forwardIn simplest terms and step by step For each quadratic relation, find the zeros and the maximum or minimum. 1) y = - 2 x2 - 28 x + 64 2) y = 6 x2 + 36 x - 42arrow_forwardWrite each relation in standard form a)y = 5(x + 10)2 + 7 b)y = 9(x - 8)2 - 4arrow_forward
- In simplest form and step by step Write the quadratic relation in standard form, then fi nd the zeros. y = 3(x - 1)2 - 147arrow_forwardStep by step instructions The path of a soccer ball can be modelled by the relation h = - 0.1 d 2 + 0.5 d + 0.6, where h is the ball’s height and d is the horizontal distance from the kicker. a) Find the zeros of the relation.arrow_forwardIn simplest terms and step by step how do you find the zeros of y = 6x2 + 24x - 192arrow_forward
 Algebra and Trigonometry (6th Edition)AlgebraISBN:9780134463216Author:Robert F. BlitzerPublisher:PEARSON
 Contemporary Abstract AlgebraAlgebraISBN:9781305657960Author:Joseph GallianPublisher:Cengage Learning
 Linear Algebra: A Modern IntroductionAlgebraISBN:9781285463247Author:David PoolePublisher:Cengage Learning
 Algebra And Trigonometry (11th Edition)AlgebraISBN:9780135163078Author:Michael SullivanPublisher:PEARSON
 Introduction to Linear Algebra, Fifth EditionAlgebraISBN:9780980232776Author:Gilbert StrangPublisher:Wellesley-Cambridge Press
 College Algebra (Collegiate Math)AlgebraISBN:9780077836344Author:Julie Miller, Donna GerkenPublisher:McGraw-Hill Education