
Concept explainers
Videos
a.
Identify the null hypothesis and alternative hypothesis.
a.
Answer to Problem 1E
Null hypothesis:
The
Alternative hypothesis:
The mean number of unpopped kernels obtained from at least one of the brand is different from the rest of the brands.
Explanation of Solution
The given information is that, a student conducted an experiment to identify whether there is any significant difference in the four popcorn brands. The number of kernels which was left unpopped were also recorded. The student measured pops of each brand four times. The F-ratio obtained from the test is 13.56.
Let
The null hypothesis is framed by assuming that all the four brands of popcorn results in the same mean number of unpopped kernels.
Null hypothesis:
The mean number of unpopped kernels obtained from each of the four brands of popcorn is the same.
Alternative hypothesis:
The mean number of unpopped kernels obtained at least one of the brand is different from the rest of the brands.
b.
Find the degrees of freedom for the treatment sum of squares and the error sum of squares.
b.
Answer to Problem 1E
The degrees of freedom for the treatment sum of squares is 3.
The degrees of freedom for the error sum of squares is 12.
Explanation of Solution
Calculation:
Degrees of freedom for treatment sum of squares:
If there are k treatments them the degrees of freedom for the treatment sum of squares is
Here, there are four brands (treatments), then the degrees of freedom is,
Substitute k as 4
Thus, the degrees of freedom for the treatment sum of squares is 3.
Degrees of freedom for the error sum of squares:
The error sum of squares for the experiment with N observations and having k treatments is
There are four brands of treatments and each treatment is applied four times. Hence, there will be
Then the degrees of freedom is,
Substitute N as 16 k as 4.
Thus, the degrees of freedom for the error sum of squares is 12.
c.
Find the P-value and give conclusion.
c.
Answer to Problem 1E
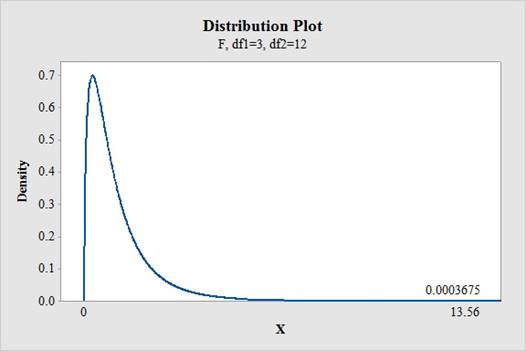
The P-value is 0.00037.
There is strong evidence to conclude that the mean number of un popped kernels is different for at least one of the four brands of popcorn.
Explanation of Solution
Calculation:
The given information is that, assume all the required conditions for ANOVA were satisfied.
The P-value is calculated as follows:
Software procedure:
Step by step procedure to find the P-value using MINITBA is given below:
- Choose Graph > Probability Distribution Plot > choose View Probability> OK.
- From Distribution, choose F.
- Enter Numerator df as 3 and Denominator df as 12.
- Under Shaded Area tab, select X Value and choose Right Tail.
- Enter the X Value as 13.56.
- Click OK.
Output obtained from MINITAB is given below:
Conclusion:
The P-value for the F-statistic is 0.00037 and the level of significance is 0.01.
The P-value is less than the level of significance.
That is,
Thus, there is strong evidence to conclude that the mean number of unpopped kernels is different for at least one of the four brands of popcorn.
d.
Suggest what else about the data would be useful to check the assumptions and conditions.
d.
Explanation of Solution
The side by side boxplot of the treatments would be useful to check the similar variance conditions and also the spread of the data.
The normal probability of residuals can be used to check the normality assumption of the error term. If the points in the normal probability plot lies approximately on a straight line it assumed that the residuals are
Also, residual plot is used to identify pattern and spread of the residuals.
Want to see more full solutions like this?
Chapter 24 Solutions
Intro STATS, Books a la Carte Plus New Mystatlab with Pearson Etext -- Access Card Package


- Show all workarrow_forwardplease find the answers for the yellows boxes using the information and the picture belowarrow_forwardA marketing agency wants to determine whether different advertising platforms generate significantly different levels of customer engagement. The agency measures the average number of daily clicks on ads for three platforms: Social Media, Search Engines, and Email Campaigns. The agency collects data on daily clicks for each platform over a 10-day period and wants to test whether there is a statistically significant difference in the mean number of daily clicks among these platforms. Conduct ANOVA test. You can provide your answer by inserting a text box and the answer must include: also please provide a step by on getting the answers in excel Null hypothesis, Alternative hypothesis, Show answer (output table/summary table), and Conclusion based on the P value.arrow_forward
- A company found that the daily sales revenue of its flagship product follows a normal distribution with a mean of $4500 and a standard deviation of $450. The company defines a "high-sales day" that is, any day with sales exceeding $4800. please provide a step by step on how to get the answers Q: What percentage of days can the company expect to have "high-sales days" or sales greater than $4800? Q: What is the sales revenue threshold for the bottom 10% of days? (please note that 10% refers to the probability/area under bell curve towards the lower tail of bell curve) Provide answers in the yellow cellsarrow_forwardBusiness Discussarrow_forwardThe following data represent total ventilation measured in liters of air per minute per square meter of body area for two independent (and randomly chosen) samples. Analyze these data using the appropriate non-parametric hypothesis testarrow_forward
 MATLAB: An Introduction with ApplicationsStatisticsISBN:9781119256830Author:Amos GilatPublisher:John Wiley & Sons Inc
 Probability and Statistics for Engineering and th...StatisticsISBN:9781305251809Author:Jay L. DevorePublisher:Cengage Learning
 Statistics for The Behavioral Sciences (MindTap C...StatisticsISBN:9781305504912Author:Frederick J Gravetter, Larry B. WallnauPublisher:Cengage Learning
 Elementary Statistics: Picturing the World (7th E...StatisticsISBN:9780134683416Author:Ron Larson, Betsy FarberPublisher:PEARSON
 The Basic Practice of StatisticsStatisticsISBN:9781319042578Author:David S. Moore, William I. Notz, Michael A. FlignerPublisher:W. H. Freeman
 Introduction to the Practice of StatisticsStatisticsISBN:9781319013387Author:David S. Moore, George P. McCabe, Bruce A. CraigPublisher:W. H. Freeman