
Statistical Reasoning for Everyday Life (5th Edition)
5th Edition
ISBN: 9780134494043
Author: Jeff Bennett, William L. Briggs, Mario F. Triola
Publisher: PEARSON
expand_more
expand_more
format_list_bulleted
Concept explainers
Videos
Textbook Question
Chapter 2.4, Problem 17E
Coffee Index. In Exercises 17–20, use the following table of index numbers based on the price of a pound of coffee. The index numbers use 2010 as the base year.
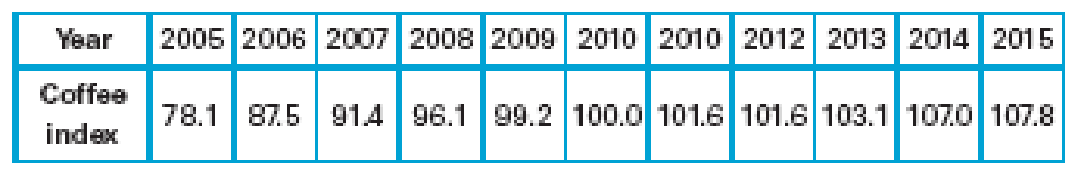
17. Coffee Price in 2010. If you spent $4.75 for a pound of coffee in 2015, what would the price have been in 2010?
Expert Solution & Answer
Want to see the full answer?
Check out a sample textbook solution
Students have asked these similar questions
Analyze the residuals of a linear regression model and select the best response.
yes, the residual plot does not show a curve
no, the residual plot shows a curve
yes, the residual plot shows a curve
no, the residual plot does not show a curve
I answered, "No, the residual plot shows a curve." (and this was incorrect). I am not sure why I keep getting these wrong when the answer seems obvious. Please help me understand what the yes and no references in the answer.
a. Find the value of A.b. Find pX(x) and py(y).c. Find pX|y(x|y) and py|X(y|x)d. Are x and y independent? Why or why not?
Analyze the residuals of a linear regression model and select the best response.Criteria is simple evaluation of possible indications of an exponential model vs. linear model)
no, the residual plot does not show a curve
yes, the residual plot does not show a curve
yes, the residual plot shows a curve
no, the residual plot shows a curve
I selected:
yes, the residual plot shows a curve and it is INCORRECT. Can u help me understand why?
Chapter 2 Solutions
Statistical Reasoning for Everyday Life (5th Edition)
Ch. 2.1 - Qualitative versus Quantitative. What is the...Ch. 2.1 - Discrete versus Continuous. Distinguish between...Ch. 2.1 - Measurement Levels. What do we mean by data at the...Ch. 2.1 - Interval versus Ratio. Explain why temperatures on...Ch. 2.1 - Does It Make Sense? For Exercises 58, determine...Ch. 2.1 - Does It Make Sense? For Exercises 58, determine...Ch. 2.1 - Does It Make Sense? For Exercises 58, determine...Ch. 2.1 - Does It Make Sense? For Exercises 58, determine...Ch. 2.1 - Does It Make Sense? For Exercises 58, determine...Ch. 2.1 - Does It Make Sense? For Exercises 58, determine...
Ch. 2.1 - Does It Make Sense? For Exercises 58, determine...Ch. 2.1 - Does It Make Sense? For Exercises 58, determine...Ch. 2.1 - Does It Make Sense? For Exercises 58, determine...Ch. 2.1 - Does It Make Sense? For Exercises 58, determine...Ch. 2.1 - Does It Make Sense? For Exercises 58, determine...Ch. 2.1 - Does It Make Sense? For Exercises 58, determine...Ch. 2.1 - Qualitative versus Quantitative Data. In Exercises...Ch. 2.1 - Qualitative versus Quantitative Data. In Exercises...Ch. 2.1 - Discrete or Continuous. In Exercises 1928, state...Ch. 2.1 - Discrete or Continuous. In Exercises 1928, state...Ch. 2.1 - Discrete or Continuous. In Exercises 1928, state...Ch. 2.1 - Discrete or Continuous. In Exercises 1928, state...Ch. 2.1 - Discrete or Continuous. In Exercises 1928, state...Ch. 2.1 - Discrete or Continuous. In Exercises 1928, state...Ch. 2.1 - Discrete or Continuous. In Exercises 1928, state...Ch. 2.1 - Discrete or Continuous. In Exercises 1928, state...Ch. 2.1 - Discrete or Continuous. In Exercises 1928, state...Ch. 2.1 - Discrete or Continuous. In Exercises 1928, state...Ch. 2.1 - Levels of Measurement. For the data described in...Ch. 2.1 - Levels of Measurement. For the data described in...Ch. 2.1 - Levels of Measurement. For the data described in...Ch. 2.1 - Levels of Measurement. For the data described in...Ch. 2.1 - Levels of Measurement. For the data described in...Ch. 2.1 - Levels of Measurement. For the data described in...Ch. 2.1 - Levels of Measurement. For the data described in...Ch. 2.1 - Levels of Measurement. For the data described in...Ch. 2.1 - Levels of Measurement. For the data described in...Ch. 2.1 - Levels of Measurement. For the data described in...Ch. 2.1 - Levels of Measurement. For the data described in...Ch. 2.1 - Levels of Measurement. For the data described in...Ch. 2.1 - Meaningful Ratios? In Exercises 4148, determine...Ch. 2.1 - Meaningful Ratios? In Exercises 4148, determine...Ch. 2.1 - Meaningful Ratios? In Exercises 4148, determine...Ch. 2.1 - Meaningful Ratios? In Exercises 4148, determine...Ch. 2.1 - Meaningful Ratios? In Exercises 4148, determine...Ch. 2.1 - Meaningful Ratios? In Exercises 4148, determine...Ch. 2.1 - Meaningful Ratios? In Exercises 4148, determine...Ch. 2.1 - Meaningful Ratios? In Exercises 4148, determine...Ch. 2.1 - Complete Classification. In Exercises 4956,...Ch. 2.1 - Complete Classification. In Exercises 4956,...Ch. 2.1 - Complete Classification. In Exercises 4956,...Ch. 2.1 - Complete Classification. In Exercises 4956,...Ch. 2.1 - Prob. 53ECh. 2.1 - Complete Classification. In Exercises 4956,...Ch. 2.1 - Prob. 55ECh. 2.1 - Complete Classification. In Exercises 4956,...Ch. 2.2 - Error Type. Distinguish between random errors and...Ch. 2.2 - Absolute and Relative. Distinguish between the...Ch. 2.2 - Accuracy and Precision. Distinguish between...Ch. 2.2 - Honest Numbers. Why can it be misleading to give...Ch. 2.2 - Does It Make Sense? For Exercises 58, determine...Ch. 2.2 - Does It Make Sense? For Exercises 58, determine...Ch. 2.2 - Does It Make Sense? For Exercises 58, determine...Ch. 2.2 - Does It Make Sense? For Exercises 58, determine...Ch. 2.2 - IRS. An IRS agent reviews tax returns to identify...Ch. 2.2 - Safe Air Travel. Before taking off, a pilot is...Ch. 2.2 - Technical Specifications. A smartphone battery is...Ch. 2.2 - Crime Statistics. Former New York City Police...Ch. 2.2 - Sources of Errors. For each measurement described...Ch. 2.2 - Sources of Errors. For each measurement described...Ch. 2.2 - Sources of Errors. For each measurement described...Ch. 2.2 - Sources of Errors. For each measurement described...Ch. 2.2 - Sources of Errors. For each measurement described...Ch. 2.2 - Sources of Errors. For each measurement described...Ch. 2.2 - Sources of Errors. For each measurement described...Ch. 2.2 - Sources of Errors. For each measurement described...Ch. 2.2 - Absolute and Relative Errors. In Exercises 2124,...Ch. 2.2 - Absolute and Relative Errors. In Exercises 2124,...Ch. 2.2 - Absolute and Relative Errors. In Exercises 2124,...Ch. 2.2 - Absolute and Relative Errors. In Exercises 2124,...Ch. 2.2 - Minimizing Errors. Twenty-five people, including...Ch. 2.2 - Minimizing Errors. When a model 22F car battery is...Ch. 2.2 - Accuracy and Precision in Corvette Weight. A new...Ch. 2.2 - Accuracy and Precision in Height. Assume that your...Ch. 2.2 - Accuracy and Precision in Weight. Suppose your...Ch. 2.2 - Prob. 30ECh. 2.2 - Believable Facts? Exercises 3138 give statements...Ch. 2.2 - Believable Facts? Exercises 3138 give statements...Ch. 2.2 - Prob. 33ECh. 2.2 - Believable Facts? Exercises 3138 give statements...Ch. 2.2 - Prob. 35ECh. 2.2 - Believable Facts? Exercises 3138 give statements...Ch. 2.2 - Believable Facts? Exercises 3138 give statements...Ch. 2.2 - Believable Facts? Exercises 3138 give statements...Ch. 2.3 - Statistical Literacy and Critical Thinking...Ch. 2.3 - Percentage Difference. Distinguish between...Ch. 2.3 - Of versus More Than. Explain the difference...Ch. 2.3 - Percentage Points. Explain the difference between...Ch. 2.3 - Does It Make Sense? For Exercises 58, determine...Ch. 2.3 - Does It Make Sense? For Exercises 58, determine...Ch. 2.3 - Does It Make Sense? For Exercises 58, determine...Ch. 2.3 - Does It Make Sense? For Exercises 58, determine...Ch. 2.3 - Concepts and Applications Fractions, Decimals,...Ch. 2.3 - Fractions, Decimals, Percentages. Express the...Ch. 2.3 - Percentage Practice. A study was conducted of...Ch. 2.3 - Percentage Practice. A study was conducted to...Ch. 2.3 - Percentage of Media commonly report survey...Ch. 2.3 - Percentage. A New York Times editorial criticized...Ch. 2.3 - Relative Change. Exercises 1522 each provide two...Ch. 2.3 - Relative Change. Exercises 1522 each provide two...Ch. 2.3 - Relative Change. Exercises 1522 each provide two...Ch. 2.3 - Relative Change. Exercises 1522 each provide two...Ch. 2.3 - Relative Change. Exercises 1522 each provide two...Ch. 2.3 - Relative Change. Exercises 1522 each provide two...Ch. 2.3 - Relative Change. Exercises 1522 each provide two...Ch. 2.3 - Relative Change. Exercises 1522 each provide two...Ch. 2.3 - Surveys. Some important analyses of survey results...Ch. 2.3 - Surveys. Some important analyses of survey results...Ch. 2.3 - Surveys. Some important analyses of survey results...Ch. 2.3 - Surveys. Some important analyses of survey results...Ch. 2.3 - Of versus More Than. Fill in the blanks in...Ch. 2.3 - Of versus More Than. Fill in the blanks in...Ch. 2.3 - Of versus More Than. Fill in the blanks in...Ch. 2.3 - Of versus More Than. Fill in the blanks in...Ch. 2.3 - Margin of Error. A Gallup poll of 1012 American...Ch. 2.3 - Margin of Error. A Pew Research Center survey of...Ch. 2.3 - Percentages of Percentages. Exercises 3336...Ch. 2.3 - Percentages of Percentages. Exercises 3336...Ch. 2.3 - Percentages of Percentages. Exercises 3336...Ch. 2.3 - Percentages of Percentages. Exercises 3336...Ch. 2.3 - TV Share. A recent Super Bowl football game had a...Ch. 2.3 - Misleading Percentage. In a Gallup poll of 1236...Ch. 2.4 - Index Number. What is an index number? Briefly...Ch. 2.4 - CPI. What is the Consumer Price Index (CPI)? How...Ch. 2.4 - Inflation. In making price comparisons, why is it...Ch. 2.4 - CPI Change. If the CPI increases, must wages also...Ch. 2.4 - Does It Make Sense? For Exercises 58, determine...Ch. 2.4 - Does It Make Sense? For Exercises 58, determine...Ch. 2.4 - Does It Make Sense? For Exercises 58, determine...Ch. 2.4 - Does It Make Sense? For Exercises 58, determine...Ch. 2.4 - Consumer Price Index. In Exercises 916, use the...Ch. 2.4 - Consumer Price Index. In Exercises 916, use the...Ch. 2.4 - Consumer Price Index. In Exercises 916, use the...Ch. 2.4 - Consumer Price Index. In Exercises 916, use the...Ch. 2.4 - Prob. 13ECh. 2.4 - Consumer Price Index. In Exercises 916, use the...Ch. 2.4 - Consumer Price Index. In Exercises 916, use the...Ch. 2.4 - Consumer Price Index. In Exercises 916, use the...Ch. 2.4 - Coffee Index. In Exercises 1720, use the following...Ch. 2.4 - Prob. 18ECh. 2.4 - Prob. 19ECh. 2.4 - Coffee Index. In Exercises 1720, use the following...Ch. 2.4 - Pizza Cost and Subway Fare. The pizza connection...Ch. 2.4 - Pizza Cost and Subway Fare. The pizza connection...Ch. 2.4 - Pizza Cost and Subway Fare. The pizza connection...Ch. 2.4 - Pizza Cost and Subway Fare. The pizza connection...Ch. 2.4 - Prob. 25ECh. 2.4 - Prob. 26ECh. 2.4 - Prob. 27ECh. 2.4 - Housing Price Index. Realtors use an index to...Ch. 2.4 - Prob. 29ECh. 2.4 - Housing Price Index. Realtors use an index to...Ch. 2.4 - Prob. 31ECh. 2.4 - Housing Price Index. Realtors use an index to...Ch. 2 - Germs. In a Wakefield Research survey, 1003...Ch. 2 - Health Care Spending. Total spending on health...Ch. 2 - Prob. 3CRECh. 2 - Minimum Wage. The following table lists the...Ch. 2 - Braking reaction times of 36 randomly selected...Ch. 2 - What is the level of measurement of the values...Ch. 2 - Prob. 3CQCh. 2 - A researcher measures the braking reaction time of...Ch. 2 - Braking reaction times of 36 randomly selected...Ch. 2 - Recorded survey results include the states in...Ch. 2 - Prob. 7CQCh. 2 - Prob. 8CQCh. 2 - Prob. 9CQCh. 2 - Prob. 10CQCh. 2 - Politics Who Benefited Most from Lower Tax Rates?...Ch. 2 - Prob. 1.2FCh. 2 - Prob. 1.3F
Knowledge Booster


Learn more about
Need a deep-dive on the concept behind this application? Look no further. Learn more about this topic, statistics and related others by exploring similar questions and additional content below.Similar questions
- You have been hired as an intern to run analyses on the data and report the results back to Sarah; the five questions that Sarah needs you to address are given below. please do it step by step on excel Does there appear to be a positive or negative relationship between price and screen size? Use a scatter plot to examine the relationship. Determine and interpret the correlation coefficient between the two variables. In your interpretation, discuss the direction of the relationship (positive, negative, or zero relationship). Also discuss the strength of the relationship. Estimate the relationship between screen size and price using a simple linear regression model and interpret the estimated coefficients. (In your interpretation, tell the dollar amount by which price will change for each unit of increase in screen size). Include the manufacturer dummy variable (Samsung=1, 0 otherwise) and estimate the relationship between screen size, price and manufacturer dummy as a multiple…arrow_forwardHere is data with as the response variable. x y54.4 19.124.9 99.334.5 9.476.6 0.359.4 4.554.4 0.139.2 56.354 15.773.8 9-156.1 319.2Make a scatter plot of this data. Which point is an outlier? Enter as an ordered pair, e.g., (x,y). (x,y)= Find the regression equation for the data set without the outlier. Enter the equation of the form mx+b rounded to three decimal places. y_wo= Find the regression equation for the data set with the outlier. Enter the equation of the form mx+b rounded to three decimal places. y_w=arrow_forwardYou have been hired as an intern to run analyses on the data and report the results back to Sarah; the five questions that Sarah needs you to address are given below. please do it step by step Does there appear to be a positive or negative relationship between price and screen size? Use a scatter plot to examine the relationship. Determine and interpret the correlation coefficient between the two variables. In your interpretation, discuss the direction of the relationship (positive, negative, or zero relationship). Also discuss the strength of the relationship. Estimate the relationship between screen size and price using a simple linear regression model and interpret the estimated coefficients. (In your interpretation, tell the dollar amount by which price will change for each unit of increase in screen size). Include the manufacturer dummy variable (Samsung=1, 0 otherwise) and estimate the relationship between screen size, price and manufacturer dummy as a multiple linear…arrow_forward
- Exercises: Find all the whole number solutions of the congruence equation. 1. 3x 8 mod 11 2. 2x+3= 8 mod 12 3. 3x+12= 7 mod 10 4. 4x+6= 5 mod 8 5. 5x+3= 8 mod 12arrow_forwardScenario Sales of products by color follow a peculiar, but predictable, pattern that determines how many units will sell in any given year. This pattern is shown below Product Color 1995 1996 1997 Red 28 42 21 1998 23 1999 29 2000 2001 2002 Unit Sales 2003 2004 15 8 4 2 1 2005 2006 discontinued Green 26 39 20 22 28 14 7 4 2 White 43 65 33 36 45 23 12 Brown 58 87 44 48 60 Yellow 37 56 28 31 Black 28 42 21 Orange 19 29 Purple Total 28 42 21 49 68 78 95 123 176 181 164 127 24 179 Questions A) Which color will sell the most units in 2007? B) Which color will sell the most units combined in the 2007 to 2009 period? Please show all your analysis, leave formulas in cells, and specify any assumptions you make.arrow_forwardOne hundred students were surveyed about their preference between dogs and cats. The following two-way table displays data for the sample of students who responded to the survey. Preference Male Female TOTAL Prefers dogs \[36\] \[20\] \[56\] Prefers cats \[10\] \[26\] \[36\] No preference \[2\] \[6\] \[8\] TOTAL \[48\] \[52\] \[100\] problem 1 Find the probability that a randomly selected student prefers dogs.Enter your answer as a fraction or decimal. \[P\left(\text{prefers dogs}\right)=\] Incorrect Check Hide explanation Preference Male Female TOTAL Prefers dogs \[\blueD{36}\] \[\blueD{20}\] \[\blueE{56}\] Prefers cats \[10\] \[26\] \[36\] No preference \[2\] \[6\] \[8\] TOTAL \[48\] \[52\] \[100\] There were \[\blueE{56}\] students in the sample who preferred dogs out of \[100\] total students.arrow_forward
- Business discussarrow_forwardYou have been hired as an intern to run analyses on the data and report the results back to Sarah; the five questions that Sarah needs you to address are given below. Does there appear to be a positive or negative relationship between price and screen size? Use a scatter plot to examine the relationship. Determine and interpret the correlation coefficient between the two variables. In your interpretation, discuss the direction of the relationship (positive, negative, or zero relationship). Also discuss the strength of the relationship. Estimate the relationship between screen size and price using a simple linear regression model and interpret the estimated coefficients. (In your interpretation, tell the dollar amount by which price will change for each unit of increase in screen size). Include the manufacturer dummy variable (Samsung=1, 0 otherwise) and estimate the relationship between screen size, price and manufacturer dummy as a multiple linear regression model. Interpret the…arrow_forwardDoes there appear to be a positive or negative relationship between price and screen size? Use a scatter plot to examine the relationship. How to take snapshots: if you use a MacBook, press Command+ Shift+4 to take snapshots. If you are using Windows, use the Snipping Tool to take snapshots. Question 1: Determine and interpret the correlation coefficient between the two variables. In your interpretation, discuss the direction of the relationship (positive, negative, or zero relationship). Also discuss the strength of the relationship. Value of correlation coefficient: Direction of the relationship (positive, negative, or zero relationship): Strength of the relationship (strong/moderate/weak): Question 2: Estimate the relationship between screen size and price using a simple linear regression model and interpret the estimated coefficients. In your interpretation, tell the dollar amount by which price will change for each unit of increase in screen size. (The answer for the…arrow_forward
- In this problem, we consider a Brownian motion (W+) t≥0. We consider a stock model (St)t>0 given (under the measure P) by d.St 0.03 St dt + 0.2 St dwt, with So 2. We assume that the interest rate is r = 0.06. The purpose of this problem is to price an option on this stock (which we name cubic put). This option is European-type, with maturity 3 months (i.e. T = 0.25 years), and payoff given by F = (8-5)+ (a) Write the Stochastic Differential Equation satisfied by (St) under the risk-neutral measure Q. (You don't need to prove it, simply give the answer.) (b) Give the price of a regular European put on (St) with maturity 3 months and strike K = 2. (c) Let X = S. Find the Stochastic Differential Equation satisfied by the process (Xt) under the measure Q. (d) Find an explicit expression for X₁ = S3 under measure Q. (e) Using the results above, find the price of the cubic put option mentioned above. (f) Is the price in (e) the same as in question (b)? (Explain why.)arrow_forwardProblem 4. Margrabe formula and the Greeks (20 pts) In the homework, we determined the Margrabe formula for the price of an option allowing you to swap an x-stock for a y-stock at time T. For stocks with initial values xo, yo, common volatility σ and correlation p, the formula was given by Fo=yo (d+)-x0Þ(d_), where In (±² Ꭲ d+ õ√T and σ = σ√√√2(1 - p). дго (a) We want to determine a "Greek" for ỡ on the option: find a formula for θα (b) Is дго θα positive or negative? (c) We consider a situation in which the correlation p between the two stocks increases: what can you say about the price Fo? (d) Assume that yo< xo and p = 1. What is the price of the option?arrow_forwardWe consider a 4-dimensional stock price model given (under P) by dẴ₁ = µ· Xt dt + йt · ΣdŴt where (W) is an n-dimensional Brownian motion, π = (0.02, 0.01, -0.02, 0.05), 0.2 0 0 0 0.3 0.4 0 0 Σ= -0.1 -4a За 0 0.2 0.4 -0.1 0.2) and a E R. We assume that ☑0 = (1, 1, 1, 1) and that the interest rate on the market is r = 0.02. (a) Give a condition on a that would make stock #3 be the one with largest volatility. (b) Find the diversification coefficient for this portfolio as a function of a. (c) Determine the maximum diversification coefficient d that you could reach by varying the value of a? 2arrow_forward
arrow_back_ios
SEE MORE QUESTIONS
arrow_forward_ios
Recommended textbooks for you
 Algebra: Structure And Method, Book 1AlgebraISBN:9780395977224Author:Richard G. Brown, Mary P. Dolciani, Robert H. Sorgenfrey, William L. ColePublisher:McDougal Littell
 Trigonometry (MindTap Course List)TrigonometryISBN:9781337278461Author:Ron LarsonPublisher:Cengage Learning
Algebra: Structure And Method, Book 1
Algebra
ISBN:9780395977224
Author:Richard G. Brown, Mary P. Dolciani, Robert H. Sorgenfrey, William L. Cole
Publisher:McDougal Littell
Trigonometry (MindTap Course List)
Trigonometry
ISBN:9781337278461
Author:Ron Larson
Publisher:Cengage Learning
The Shape of Data: Distributions: Crash Course Statistics #7; Author: CrashCourse;https://www.youtube.com/watch?v=bPFNxD3Yg6U;License: Standard YouTube License, CC-BY
Shape, Center, and Spread - Module 20.2 (Part 1); Author: Mrmathblog;https://www.youtube.com/watch?v=COaid7O_Gag;License: Standard YouTube License, CC-BY
Shape, Center and Spread; Author: Emily Murdock;https://www.youtube.com/watch?v=_YyW0DSCzpM;License: Standard Youtube License