
Concept explainers
(a)
To find:
The
Answer to Problem 14E
The equilibrium
Explanation of Solution
Demand:
The quantity demanded of goods at different prices is referred as the demand for the goods. Demand curve is downward sloping.
Supply:
The quantity supplied of a good at different prices is referred as the supply of that good. Supply curve is upward sloping.
Market Equilibrium:
It refers to a situation where the forces of demand and supply are balanced.
(b)
To show:
The graphical representation of demand and supply curves.
Whether the demand and supply curves represent an individual firm's or market demand and supply curves, assuming market to be
Answer to Problem 14E
The graph of demand and supply curves is as shown below:
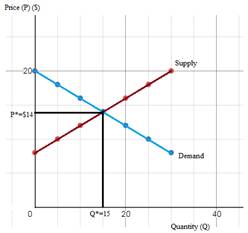
Figure (1)
The demand and supply curves given here are market demand and supply curves.
MC (Marginal Cost) is the supply curve and gives quantity supplied at each price for individual firm.
Explanation of Solution
In the Figure (1), the demand and supply curves and the equilibrium price and quantity are shown. Perfectly competitive market structure is one where there are large number of buyers and sellers. Other features of perfect competition are:
- Homogeneous products
- Industry is the price maker
- Firm is the price taker
- No individual buyer or seller can influence industry price
- Demand curve is AR curve which shows P=AR=MR.
Under perfect competition, individual firm's demand curve is the AR curve and since AR is constant for all levels of output, the demand curve is horizontal straight line. However, the market demand curve slopes downwards since it represents that industry output would be lower at a higher price and vice-versa.Therefore, the demand and supply curves given here are market demand and supply curves.
For a firm, quantity supplied is given by the MC curve. It is because, under perfect competition, at equilibrium, P=MR (=MC). Therefore, MC is the supply curvewhich gives quantity supplied at each price.
Perfect competition:
It is a market structure where large number of buyers and sellers exist, and products are homogeneous.
Market demand:
Market demand for a good is the summation of all individual demands for that good.
Market supply:
Market supply is the summation of all individual supplies of that good.
Marginal Cost (MC):
The additional cost of producing an extra unit of output is referred to as the marginal cost of producing that unit of output.
(c)
To show:
The
Answer to Problem 14E
At P*=$14 and Q*=15 units, the
Explanation of Solution
The consumer surplus and producer surplus are calculated below and shown graphically in the diagram below.
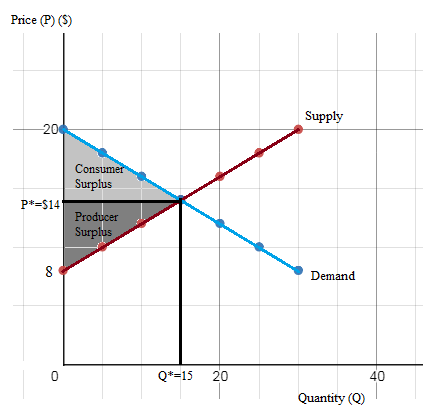
Figure (2)
Consumer surplus:
Consumer surplus is the difference between consumers' willingness to pay and the price that is charged to them. Graphically, it is the area between the demand curve and price line.
Producer surplus:
Producer surplus is the difference between the price producers receive and cost of production. Graphically, it is the area between the price line and the supply curve.
(d)
To explain:
The change in consumer and producer surplus as a result of a
Answer to Problem 14E
Change in consumer surplus after price ceiling is $15. That is, after price ceiling, consumer surplus increases by $15. The change in producer surplus after price ceiling is -$25. That is, after price ceiling, consumer surplus decreases by $25.
Change in consumer surplus after price floor is -$25. That is, after price floor, consumer surplus decreases by $25. The change in producer surplus after price floor is $15. That is, after price floor, producer surplus increases by $15.
Explanation of Solution
There is a price ceiling of $12 and equilibrium price is $14. Therefore, a price ceiling of $12 is binding. The effect of a price ceiling is shown in the diagram below. The new consumer and producer surplus with a price ceiling of $12 is calculated below.
The diagram is as shown below:
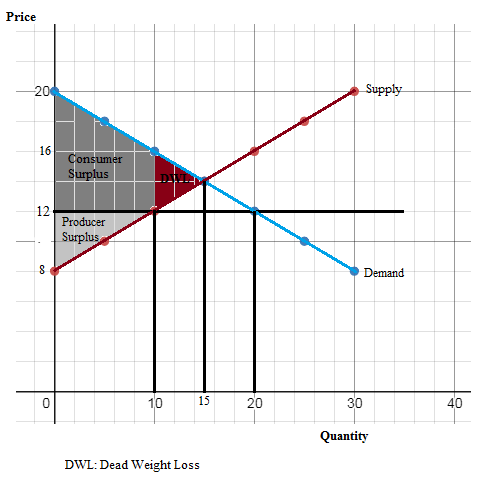
Figure (3)
Change in consumer surplus after price ceiling is $15. That is, after price ceiling, consumer surplus increases by $15.
Change in producer surplus after price ceiling is -$25. That is, after price ceiling, consumer surplus decreases by $25.
A price floor is binding if it is above equilibrium price. The equilibrium price without floor is $14. Therefore, a price floor of $16 would be binding. The effect of a price ceiling is shown in the diagram below. The new consumer and producer surplus with a price ceiling of $12 is calculated below.
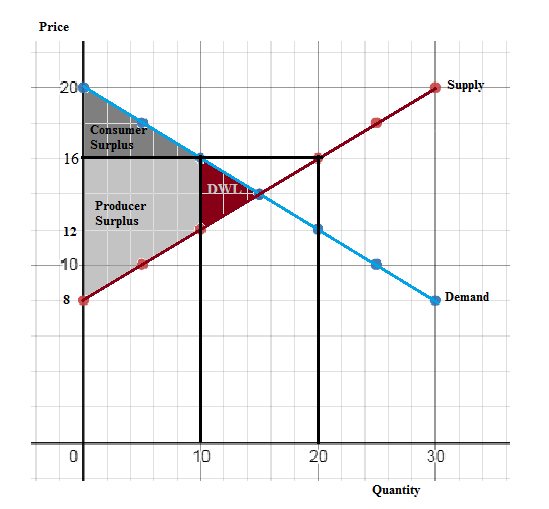
Figure (4)
Change in consumer surplus after price ceiling is -$25. That is, after price ceiling, consumer surplus decreases by $25.Change in producer surplus after price ceiling is $15. That is, after price ceiling, producer surplus increases by $15.
Consumer surplus:
Consumer surplus is the difference between consumers' willingness to pay and the price that is charged to them. Graphically, it is the area between the demand curve and price line.
Producer surplus:
Producer surplus is the difference between the price producers receive and cost of production. Graphically, it is the area between the price line and the supply curve.
Price ceiling:
A price ceiling is an upper limit for price which is generally imposed by the government.
Price floor:
A price floor is a lower limit for price which is generally imposed by the government.
Want to see more full solutions like this?


- Styrofoam is non-biodegradable and is not easily recyclable. Many cities and at least one state have enacted laws that ban the use of polystyrene containers. These locales understand that banning these containers will force many businesses to turn to other more expensive forms of packaging and cups, but argue the ban is environmentally important. Shane owns a firm with a conventional production function resulting in U-shaped ATC, AVC, and MC curves. Shane's business sells takeout food and drinks that are currently packaged in styrofoam containers and cups. Graph the short-run AFC0, AVC0, ATC0, and MC0 curves for Shane's firm before the ban on using styrofoam containers.arrow_forwardd-farrow_forwarda-c pleasearrow_forward
- d-farrow_forwardPART II: Multipart Problems wood or solem of triflussd aidi 1. Assume that a society has a polluting industry comprising two firms, where the industry-level marginal abatement cost curve is given by: MAC = 24 - ()E and the marginal damage function is given by: MDF = 2E. What is the efficient level of emissions? b. What constant per-unit emissions tax could achieve the efficient emissions level? points) c. What is the net benefit to society of moving from the unregulated emissions level to the efficient level? In response to industry complaints about the costs of the tax, a cap-and-trade program is proposed. The marginal abatement cost curves for the two firms are given by: MAC=24-E and MAC2 = 24-2E2. d. How could a cap-and-trade program that achieves the same level of emissions as the tax be designed to reduce the costs of regulation to the two firms?arrow_forwardOnly #4 please, Use a graph please if needed to help provearrow_forward
- a-carrow_forwardFor these questions, you must state "true," "false," or "uncertain" and argue your case (roughly 3 to 5 sentences). When appropriate, the use of graphs will make for stronger answers. Credit will depend entirely on the quality of your explanation. 1. If the industry facing regulation for its pollutant emissions has a lot of political capital, direct regulatory intervention will be more viable than an emissions tax to address this market failure. 2. A stated-preference method will provide a measure of the value of Komodo dragons that is more accurate than the value estimated through application of the travel cost model to visitation data for Komodo National Park in Indonesia. 3. A correlation between community demographics and the present location of polluting facilities is sufficient to claim a violation of distributive justice. olsvrc Q 4. When the damages from pollution are uncertain, a price-based mechanism is best equipped to manage the costs of the regulator's imperfect…arrow_forwardFor environmental economics, question number 2 only please-- thank you!arrow_forward
- For these questions, you must state "true," "false," or "uncertain" and argue your case (roughly 3 to 5 sentences). When appropriate, the use of graphs will make for stronger answers. Credit will depend entirely on the quality of your explanation. 1. If the industry facing regulation for its pollutant emissions has a lot of political capital, direct regulatory intervention will be more viable than an emissions tax to address this market failure. cullog iba linevoz ve bubivorearrow_forwardExercise 3 The production function of a firm is described by the following equation Q=10,000-3L2 where L stands for the units of labour. a) Draw a graph for this equation. Use the quantity produced in the y-axis, and the units of labour in the x-axis. b) What is the maximum production level? c) How many units of labour are needed at that point? d) Provide one reference with you answer.arrow_forwardExercise 1 Consider the market supply curve which passes through the intercept and from which the market equilibrium data is known, this is, the price and quantity of equilibrium PE=50 and QE=2000. Considering those two points, find the equation of the supply. Draw a graph of this line. Provide one reference with your answer. Exercise 2 Considering the previous supply line, determine if the following demand function corresponds to the market demand equilibrium stated above. QD=3000-2p.arrow_forward


 Managerial Economics: A Problem Solving ApproachEconomicsISBN:9781337106665Author:Luke M. Froeb, Brian T. McCann, Michael R. Ward, Mike ShorPublisher:Cengage Learning

