
INTRO.STATISTICS,TECH.UPDT.-W/MYSTATLAB
10th Edition
ISBN: 9780135230008
Author: WEISS
Publisher: PEARSON
expand_more
expand_more
format_list_bulleted
Videos
Textbook Question
Chapter 2.4, Problem 146E
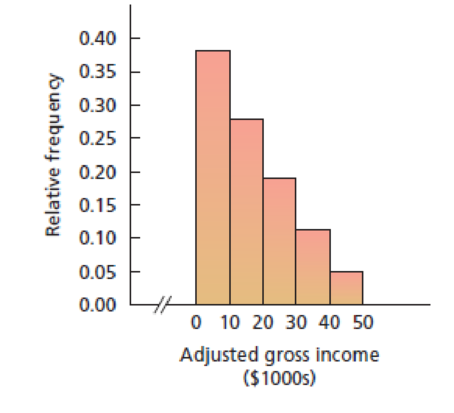
In each of Exercises 2.140–2.149, we have provided a graphical display of a data set. For each exercise, state whether the distribution is (roughly) symmetric, right skewed, or left skewed.
2.146 Adjusted Gross Incomes. The Internal Revenue Service (IRS) publishes data on adjusted gross incomes in the document Statistics of Income, Individual Income Tax Returns. The following relative-frequency histogram shows one year’s individual income tax returns for adjusted gross incomes of less than $50,000.
Expert Solution & Answer
Want to see the full answer?
Check out a sample textbook solution
Students have asked these similar questions
a. Find the value of A.b. Find pX(x) and py(y).c. Find pX|y(x|y) and py|X(y|x)d. Are x and y independent? Why or why not?
Analyze the residuals of a linear regression model and select the best response.Criteria is simple evaluation of possible indications of an exponential model vs. linear model)
no, the residual plot does not show a curve
yes, the residual plot does not show a curve
yes, the residual plot shows a curve
no, the residual plot shows a curve
I selected:
yes, the residual plot shows a curve and it is INCORRECT. Can u help me understand why?
You have been hired as an intern to run analyses on the data and report the results back to Sarah; the five questions that Sarah needs you to address are given below.
please do it step by step on excel
Does there appear to be a positive or negative relationship between price and screen size? Use a scatter plot to examine the relationship.
Determine and interpret the correlation coefficient between the two variables. In your interpretation, discuss the direction of the relationship (positive, negative, or zero relationship). Also discuss the strength of the relationship.
Estimate the relationship between screen size and price using a simple linear regression model and interpret the estimated coefficients. (In your interpretation, tell the dollar amount by which price will change for each unit of increase in screen size).
Include the manufacturer dummy variable (Samsung=1, 0 otherwise) and estimate the relationship between screen size, price and manufacturer dummy as a multiple…
Chapter 2 Solutions
INTRO.STATISTICS,TECH.UPDT.-W/MYSTATLAB
Ch. 2.1 - Give an example, other than those presented in...Ch. 2.1 - Explain the meaning of a. qualitative variable. b....Ch. 2.1 - Explain the meaning of a. qualitative data. b....Ch. 2.1 - Provide a reason why the classification of data is...Ch. 2.1 - Of the variables you have studied so far, which...Ch. 2.1 - For each part of Exercises 2.62.11, classify the...Ch. 2.1 - Earthquakes. The U.S. Geological Survey monitors...Ch. 2.1 - Top 10 IPOs. An online article from the Washington...Ch. 2.1 - Earnings from the Crypt. On the Celebrity NetWorth...Ch. 2.1 - World University Rankings. The Times Higher...
Ch. 2.1 - Recording Industry Statistics. The Recording...Ch. 2.1 - RBI Kings. As reported on MLB.com, the five...Ch. 2.1 - Top Broadcast Shows. As reported in Primetime...Ch. 2.1 - The Fulbright Program. The U.S. governments...Ch. 2.1 - Top 10 Green Cars. The following table presents...Ch. 2.1 - Ordinal Data. Another important type of data is...Ch. 2.2 - What is a frequency distribution of qualitative...Ch. 2.2 - Explain the difference between a. frequency and...Ch. 2.2 - Answer true or false to each of the statements in...Ch. 2.2 - In Exercises 2.202.25, we have presented some...Ch. 2.2 - Prob. 21ECh. 2.2 - In Exercises 2.202.25, we have presented some...Ch. 2.2 - Prob. 23ECh. 2.2 - In Exercises 2.202.25, we have presented some...Ch. 2.2 - In Exercises 2.202.25, we have presented some...Ch. 2.2 - For each data set in Exercises 2.262.31, a....Ch. 2.2 - For each data set in Exercises 2.262.31, a....Ch. 2.2 - For each data set in Exercises 2.262.31, a....Ch. 2.2 - For each data set in Exercises 2.262.31, a....Ch. 2.2 - For each data set in Exercises 2.262.31, a....Ch. 2.2 - For each data set in Exercises 2.262.31, a....Ch. 2.2 - In each of Exercises 2.322.37, we have presented a...Ch. 2.2 - In each of Exercises 2.322.37, we have presented a...Ch. 2.2 - In each of Exercises 2.322.37, we have presented a...Ch. 2.2 - In each of Exercises 2.322.37, we have presented a...Ch. 2.2 - In each of Exercises 2.322.37, we have presented a...Ch. 2.2 - Prob. 37ECh. 2.2 - Health Status. The National Center for Health...Ch. 2.2 - In Exercises 2.392.41, use the technology of your...Ch. 2.2 - Prob. 40ECh. 2.2 - In Exercises 2.392.41, use the technology of your...Ch. 2.3 - Identify an important reason for grouping data.Ch. 2.3 - Do the concepts of class limits, marks, cutpoints,...Ch. 2.3 - State three of the most important guidelines in...Ch. 2.3 - With regard to grouping quantitative data into...Ch. 2.3 - For quantitative data, we examined three types of...Ch. 2.3 - We used slightly different methods for determining...Ch. 2.3 - Explain the difference between a frequency...Ch. 2.3 - Explain the advantages and disadvantages of...Ch. 2.3 - For data that are grouped in classes based on more...Ch. 2.3 - Discuss the relative advantages and disadvantages...Ch. 2.3 - Suppose that you have a data set that contains a...Ch. 2.3 - Suppose that you have constructed a stem-and-leaf...Ch. 2.3 - In each of Exercises 2.542.59, we have presented a...Ch. 2.3 - In each of Exercises 2.542.59, we have presented a...Ch. 2.3 - In each of Exercises 2.542.59, we have presented a...Ch. 2.3 - In each of Exercises 2.542.59, we have presented a...Ch. 2.3 - Prob. 58ECh. 2.3 - In each of Exercises 2.542.59, we have presented a...Ch. 2.3 - Prob. 60ECh. 2.3 - Prob. 61ECh. 2.3 - In Exercises 2.602.71, we have presented some...Ch. 2.3 - In Exercises 2.602.71, we have presented some...Ch. 2.3 - In Exercises 2.602.71, we have presented some...Ch. 2.3 - In Exercises 2.602.71, we have presented some...Ch. 2.3 - Prob. 66ECh. 2.3 - In Exercises 2.602.71, we have presented some...Ch. 2.3 - In Exercises 2.602.71, we have presented some...Ch. 2.3 - Prob. 69ECh. 2.3 - In Exercises 2.602.71, we have presented some...Ch. 2.3 - In Exercises 2.602.71, we have presented some...Ch. 2.3 - Prob. 72ECh. 2.3 - In each of Exercises 2.722.75, construct a dotplot...Ch. 2.3 - Prob. 74ECh. 2.3 - In each of Exercises 2.722.75, construct a dotplot...Ch. 2.3 - In each of Exercises 2.762.79, construct a...Ch. 2.3 - Prob. 77ECh. 2.3 - In each of Exercises 2.762.79, construct a...Ch. 2.3 - Prob. 79ECh. 2.3 - Prob. 80ECh. 2.3 - For each data set in Exercises 2.802.91, use the...Ch. 2.3 - For each data set in Exercises 2.802.91, use the...Ch. 2.3 - For each data set in Exercises 2.802.91, use the...Ch. 2.3 - For each data set in Exercises 2.802.91, use the...Ch. 2.3 - For each data set in Exercises 2.802.91, use the...Ch. 2.3 - For each data set in Exercises 2.802.91, use the...Ch. 2.3 - Prob. 87ECh. 2.3 - Prob. 88ECh. 2.3 - Prob. 89ECh. 2.3 - Prob. 90ECh. 2.3 - Prob. 91ECh. 2.3 - Prob. 92ECh. 2.3 - Age of Passenger Cars. According to R. L. Polk ...Ch. 2.3 - Stressed-Out Bus Drivers. Frustrated passengers,...Ch. 2.3 - Acute Postoperative Days. Several neurosurgeons...Ch. 2.3 - MMs. In the article Sweetening StatisticsWhat MMs...Ch. 2.3 - Women in the Workforce. In an issue of Science...Ch. 2.3 - Process Capability. R. Morris and E. Watson...Ch. 2.3 - University Patents. The number of patents a...Ch. 2.3 - Prob. 100ECh. 2.3 - Prob. 101ECh. 2.3 - Adjusted Gross Incomes. The Internal Revenue...Ch. 2.3 - Cholesterol Levels. According to the National...Ch. 2.3 - Hospital Beds. The number of hospital beds...Ch. 2.3 - Parkinsons Disease. Parkinsons disease affects...Ch. 2.3 - The Great White Shark. In an article titled Great...Ch. 2.3 - The Beatles. In the article, Length of The Beatles...Ch. 2.3 - High School Completion. As reported by the U.S....Ch. 2.3 - Prob. 109ECh. 2.3 - Body Temperature. A study by researchers at the...Ch. 2.3 - Exam Scores. The exam scores for the students in...Ch. 2.3 - Prob. 112ECh. 2.3 - Prob. 113ECh. 2.3 - Age and Gender. The following bivariate data on...Ch. 2.3 - Prob. 115ECh. 2.3 - Clocking the Cheetah. Construct a...Ch. 2.3 - Prob. 117ECh. 2.3 - Residential Energy Consumption. Refer to the...Ch. 2.3 - Prob. 119ECh. 2.3 - Cardiovascular Hospitalizations. The Florida State...Ch. 2.3 - Prob. 121ECh. 2.4 - In each of Exercises 2.1222.127, explain the...Ch. 2.4 - In each of Exercises 2.1222.127, explain the...Ch. 2.4 - In each of Exercises 2.1222.127, explain the...Ch. 2.4 - Prob. 125ECh. 2.4 - Prob. 126ECh. 2.4 - Prob. 127ECh. 2.4 - Prob. 128ECh. 2.4 - Suppose that a variable of a population has a...Ch. 2.4 - Prob. 130ECh. 2.4 - Identify and sketch three distribution shapes that...Ch. 2.4 - Prob. 132ECh. 2.4 - In each of Exercises 2.1322.139, we have drawn a...Ch. 2.4 - In each of Exercises 2.1322.139, we have drawn a...Ch. 2.4 - In each of Exercises 2.1322.139, we have drawn a...Ch. 2.4 - In each of Exercises 2.1322.139, we have drawn a...Ch. 2.4 - In each of Exercises 2.1322.139, we have drawn a...Ch. 2.4 - In each of Exercises 2.1322.139, we have drawn a...Ch. 2.4 - Prob. 139ECh. 2.4 - In each of Exercises 2.1402.149, we have provided...Ch. 2.4 - In each of Exercises 2.1402.149, we have provided...Ch. 2.4 - Prob. 142ECh. 2.4 - In each of Exercises 2.1402.149, we have provided...Ch. 2.4 - In each of Exercises 2.1402.149, we have provided...Ch. 2.4 - In each of Exercises 2.1402.149, we have provided...Ch. 2.4 - In each of Exercises 2.1402.149, we have provided...Ch. 2.4 - Prob. 147ECh. 2.4 - Prob. 148ECh. 2.4 - Prob. 149ECh. 2.4 - Old Faithful. Old Faithful is a geyser in...Ch. 2.4 - SnowGoose Nests. In the article Trophic...Ch. 2.4 - Prob. 152ECh. 2.4 - In each of Exercises 2.1522.157, a. use the...Ch. 2.4 - In each of Exercises 2.1522.157, a. use the...Ch. 2.4 - Prob. 155ECh. 2.4 - In each of Exercises 2.1522.157, a. use the...Ch. 2.4 - In each of Exercises 2.1522.157, a. use the...Ch. 2.4 - Standard Normal Distribution. One of the most...Ch. 2.5 - Give one reason why constructing and reading...Ch. 2.5 - Prob. 163ECh. 2.5 - Reading Skills. Each year the director of the...Ch. 2.5 - Americas Melting Pot. The U.S. Census Bureau...Ch. 2.5 - Prob. 167ECh. 2.5 - Drunk-Driving Fatalities. Drunk-driving fatalities...Ch. 2.5 - Prob. 169ECh. 2.5 - Prob. 170ECh. 2.5 - Prob. 171ECh. 2 - This problem is about variables. a. What is a...Ch. 2 - This problem is about data. a. What are data? b....Ch. 2 - For a qualitative data set, what is a a. frequency...Ch. 2 - What is the relationship between a frequency or...Ch. 2 - Identify two main types of graphical displays that...Ch. 2 - In a bar chart, unlike in a histogram, the bars do...Ch. 2 - Some users of statistics prefer pie charts to bar...Ch. 2 - When is the use of single-value grouping...Ch. 2 - A quantitative data set has been grouped by using...Ch. 2 - A quantitative data set has been grouped by using...Ch. 2 - A quantitative data set has been grouped by using...Ch. 2 - A quantitative data set has been grouped by using...Ch. 2 - Explain the relative positioning of the bars in a...Ch. 2 - Sketch the curve corresponding to each of the...Ch. 2 - Draw a smooth curve that represents a symmetric...Ch. 2 - Prob. 16RPCh. 2 - Largest Hydroelectric Plants. According to...Ch. 2 - DVD Players. Refer to Example 2.16 on page 60. a....Ch. 2 - Inauguration Ages. From the Information Please...Ch. 2 - Inauguration Ages. Refer to Problem 19. Construct...Ch. 2 - Prob. 21RPCh. 2 - Prob. 22RPCh. 2 - Busy Bank Tellers. The Prescott National Bank has...Ch. 2 - On-Time Arrivals. The Air Travel Consumer Report...Ch. 2 - Old Ballplayers. From the ESPN Web site, we...Ch. 2 - Prob. 26RPCh. 2 - U.S. Divisions. The U.S. Census Bureau divides the...Ch. 2 - Prob. 28RPCh. 2 - Prob. 29RPCh. 2 - Hair and Eye Color. In the article Graphical...Ch. 2 - Prob. 31RPCh. 2 - In Problems 3133, a. identify the population and...Ch. 2 - In Problems 3133, a. identify the population and...Ch. 2 - UWEC UNDERGRADUATES Recall from Chapter 1 (see...Ch. 2 - Recall that, each year, Forbes magazine publishes...
Knowledge Booster


Learn more about
Need a deep-dive on the concept behind this application? Look no further. Learn more about this topic, statistics and related others by exploring similar questions and additional content below.Similar questions
- Here is data with as the response variable. x y54.4 19.124.9 99.334.5 9.476.6 0.359.4 4.554.4 0.139.2 56.354 15.773.8 9-156.1 319.2Make a scatter plot of this data. Which point is an outlier? Enter as an ordered pair, e.g., (x,y). (x,y)= Find the regression equation for the data set without the outlier. Enter the equation of the form mx+b rounded to three decimal places. y_wo= Find the regression equation for the data set with the outlier. Enter the equation of the form mx+b rounded to three decimal places. y_w=arrow_forwardYou have been hired as an intern to run analyses on the data and report the results back to Sarah; the five questions that Sarah needs you to address are given below. please do it step by step Does there appear to be a positive or negative relationship between price and screen size? Use a scatter plot to examine the relationship. Determine and interpret the correlation coefficient between the two variables. In your interpretation, discuss the direction of the relationship (positive, negative, or zero relationship). Also discuss the strength of the relationship. Estimate the relationship between screen size and price using a simple linear regression model and interpret the estimated coefficients. (In your interpretation, tell the dollar amount by which price will change for each unit of increase in screen size). Include the manufacturer dummy variable (Samsung=1, 0 otherwise) and estimate the relationship between screen size, price and manufacturer dummy as a multiple linear…arrow_forwardExercises: Find all the whole number solutions of the congruence equation. 1. 3x 8 mod 11 2. 2x+3= 8 mod 12 3. 3x+12= 7 mod 10 4. 4x+6= 5 mod 8 5. 5x+3= 8 mod 12arrow_forward
- Scenario Sales of products by color follow a peculiar, but predictable, pattern that determines how many units will sell in any given year. This pattern is shown below Product Color 1995 1996 1997 Red 28 42 21 1998 23 1999 29 2000 2001 2002 Unit Sales 2003 2004 15 8 4 2 1 2005 2006 discontinued Green 26 39 20 22 28 14 7 4 2 White 43 65 33 36 45 23 12 Brown 58 87 44 48 60 Yellow 37 56 28 31 Black 28 42 21 Orange 19 29 Purple Total 28 42 21 49 68 78 95 123 176 181 164 127 24 179 Questions A) Which color will sell the most units in 2007? B) Which color will sell the most units combined in the 2007 to 2009 period? Please show all your analysis, leave formulas in cells, and specify any assumptions you make.arrow_forwardOne hundred students were surveyed about their preference between dogs and cats. The following two-way table displays data for the sample of students who responded to the survey. Preference Male Female TOTAL Prefers dogs \[36\] \[20\] \[56\] Prefers cats \[10\] \[26\] \[36\] No preference \[2\] \[6\] \[8\] TOTAL \[48\] \[52\] \[100\] problem 1 Find the probability that a randomly selected student prefers dogs.Enter your answer as a fraction or decimal. \[P\left(\text{prefers dogs}\right)=\] Incorrect Check Hide explanation Preference Male Female TOTAL Prefers dogs \[\blueD{36}\] \[\blueD{20}\] \[\blueE{56}\] Prefers cats \[10\] \[26\] \[36\] No preference \[2\] \[6\] \[8\] TOTAL \[48\] \[52\] \[100\] There were \[\blueE{56}\] students in the sample who preferred dogs out of \[100\] total students.arrow_forwardBusiness discussarrow_forward
- You have been hired as an intern to run analyses on the data and report the results back to Sarah; the five questions that Sarah needs you to address are given below. Does there appear to be a positive or negative relationship between price and screen size? Use a scatter plot to examine the relationship. Determine and interpret the correlation coefficient between the two variables. In your interpretation, discuss the direction of the relationship (positive, negative, or zero relationship). Also discuss the strength of the relationship. Estimate the relationship between screen size and price using a simple linear regression model and interpret the estimated coefficients. (In your interpretation, tell the dollar amount by which price will change for each unit of increase in screen size). Include the manufacturer dummy variable (Samsung=1, 0 otherwise) and estimate the relationship between screen size, price and manufacturer dummy as a multiple linear regression model. Interpret the…arrow_forwardDoes there appear to be a positive or negative relationship between price and screen size? Use a scatter plot to examine the relationship. How to take snapshots: if you use a MacBook, press Command+ Shift+4 to take snapshots. If you are using Windows, use the Snipping Tool to take snapshots. Question 1: Determine and interpret the correlation coefficient between the two variables. In your interpretation, discuss the direction of the relationship (positive, negative, or zero relationship). Also discuss the strength of the relationship. Value of correlation coefficient: Direction of the relationship (positive, negative, or zero relationship): Strength of the relationship (strong/moderate/weak): Question 2: Estimate the relationship between screen size and price using a simple linear regression model and interpret the estimated coefficients. In your interpretation, tell the dollar amount by which price will change for each unit of increase in screen size. (The answer for the…arrow_forwardIn this problem, we consider a Brownian motion (W+) t≥0. We consider a stock model (St)t>0 given (under the measure P) by d.St 0.03 St dt + 0.2 St dwt, with So 2. We assume that the interest rate is r = 0.06. The purpose of this problem is to price an option on this stock (which we name cubic put). This option is European-type, with maturity 3 months (i.e. T = 0.25 years), and payoff given by F = (8-5)+ (a) Write the Stochastic Differential Equation satisfied by (St) under the risk-neutral measure Q. (You don't need to prove it, simply give the answer.) (b) Give the price of a regular European put on (St) with maturity 3 months and strike K = 2. (c) Let X = S. Find the Stochastic Differential Equation satisfied by the process (Xt) under the measure Q. (d) Find an explicit expression for X₁ = S3 under measure Q. (e) Using the results above, find the price of the cubic put option mentioned above. (f) Is the price in (e) the same as in question (b)? (Explain why.)arrow_forward
- Problem 4. Margrabe formula and the Greeks (20 pts) In the homework, we determined the Margrabe formula for the price of an option allowing you to swap an x-stock for a y-stock at time T. For stocks with initial values xo, yo, common volatility σ and correlation p, the formula was given by Fo=yo (d+)-x0Þ(d_), where In (±² Ꭲ d+ õ√T and σ = σ√√√2(1 - p). дго (a) We want to determine a "Greek" for ỡ on the option: find a formula for θα (b) Is дго θα positive or negative? (c) We consider a situation in which the correlation p between the two stocks increases: what can you say about the price Fo? (d) Assume that yo< xo and p = 1. What is the price of the option?arrow_forwardWe consider a 4-dimensional stock price model given (under P) by dẴ₁ = µ· Xt dt + йt · ΣdŴt where (W) is an n-dimensional Brownian motion, π = (0.02, 0.01, -0.02, 0.05), 0.2 0 0 0 0.3 0.4 0 0 Σ= -0.1 -4a За 0 0.2 0.4 -0.1 0.2) and a E R. We assume that ☑0 = (1, 1, 1, 1) and that the interest rate on the market is r = 0.02. (a) Give a condition on a that would make stock #3 be the one with largest volatility. (b) Find the diversification coefficient for this portfolio as a function of a. (c) Determine the maximum diversification coefficient d that you could reach by varying the value of a? 2arrow_forwardQuestion 1. Your manager asks you to explain why the Black-Scholes model may be inappro- priate for pricing options in practice. Give one reason that would substantiate this claim? Question 2. We consider stock #1 and stock #2 in the model of Problem 2. Your manager asks you to pick only one of them to invest in based on the model provided. Which one do you choose and why ? Question 3. Let (St) to be an asset modeled by the Black-Scholes SDE. Let Ft be the price at time t of a European put with maturity T and strike price K. Then, the discounted option price process (ert Ft) t20 is a martingale. True or False? (Explain your answer.) Question 4. You are considering pricing an American put option using a Black-Scholes model for the underlying stock. An explicit formula for the price doesn't exist. In just a few words (no more than 2 sentences), explain how you would proceed to price it. Question 5. We model a short rate with a Ho-Lee model drt = ln(1+t) dt +2dWt. Then the interest rate…arrow_forward
arrow_back_ios
SEE MORE QUESTIONS
arrow_forward_ios
Recommended textbooks for you
 Holt Mcdougal Larson Pre-algebra: Student Edition...AlgebraISBN:9780547587776Author:HOLT MCDOUGALPublisher:HOLT MCDOUGAL
 Big Ideas Math A Bridge To Success Algebra 1: Stu...AlgebraISBN:9781680331141Author:HOUGHTON MIFFLIN HARCOURTPublisher:Houghton Mifflin Harcourt
 Trigonometry (MindTap Course List)TrigonometryISBN:9781337278461Author:Ron LarsonPublisher:Cengage Learning
Holt Mcdougal Larson Pre-algebra: Student Edition...
Algebra
ISBN:9780547587776
Author:HOLT MCDOUGAL
Publisher:HOLT MCDOUGAL
Big Ideas Math A Bridge To Success Algebra 1: Stu...
Algebra
ISBN:9781680331141
Author:HOUGHTON MIFFLIN HARCOURT
Publisher:Houghton Mifflin Harcourt
Trigonometry (MindTap Course List)
Trigonometry
ISBN:9781337278461
Author:Ron Larson
Publisher:Cengage Learning
Hypothesis Testing using Confidence Interval Approach; Author: BUM2413 Applied Statistics UMP;https://www.youtube.com/watch?v=Hq1l3e9pLyY;License: Standard YouTube License, CC-BY
Hypothesis Testing - Difference of Two Means - Student's -Distribution & Normal Distribution; Author: The Organic Chemistry Tutor;https://www.youtube.com/watch?v=UcZwyzwWU7o;License: Standard Youtube License