![Elementary Statistics with MyStatLab Access Code [With CDROM]](https://www.bartleby.com/isbn_cover_images/9780321890238/9780321890238_largeCoverImage.gif)
Elementary Statistics with MyStatLab Access Code [With CDROM]
12th Edition
ISBN: 9780321890238
Author: Mario F. Triola
Publisher: PEARSON
expand_more
expand_more
format_list_bulleted
Videos
Textbook Question
Chapter 2.4, Problem 10BSC
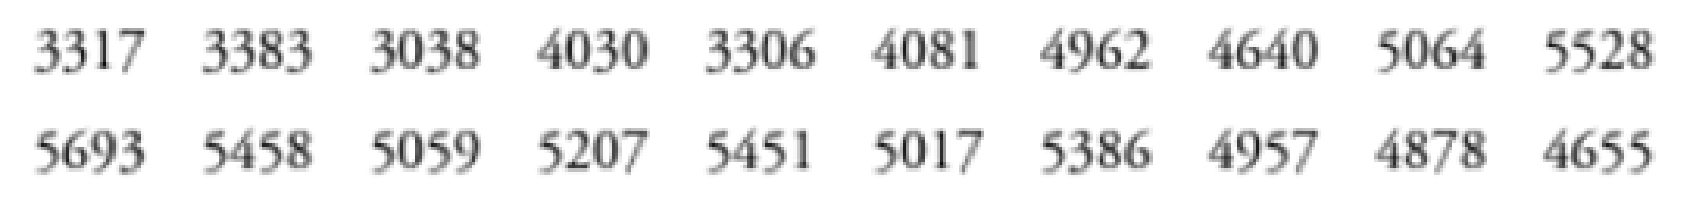
Time-Series Graphs. In Exercises 9 and 10, construct the time-series graph.
10. Home Runs Listed below are the numbers of home runs in major league baseball for each year beginning with 1990 (listed in order by row). Is there a trend?
Expert Solution & Answer
Want to see the full answer?
Check out a sample textbook solution
Students have asked these similar questions
In a study on speed control, it was found that the main reasons for regulations were to make traffic flow efficient and to minimize the risk of danger. An area that was focused on in the study was the distance required to completely stop a vehicle at various speeds. Use the following table to answer the questions.
MPH
Braking distance (yrds)
5
10
10
17
20
27
30
50
40
60
50
100
60
150
70
200
Business
3. Bayesian Inference – Updating Beliefs
A medical test for a rare disease has the following characteristics:
Sensitivity (true positive rate): 99%
Specificity (true negative rate): 98%
The disease occurs in 0.5% of the population.
A patient receives a positive test result.
Questions:
a) Define the relevant events and use Bayes’ Theorem to compute the probability that the patient actually has the disease.b) Explain why the result might seem counterintuitive, despite the high sensitivity and specificity.c) Discuss how prior probabilities influence posterior beliefs in Bayesian inference.d) Suppose a second, independent test with the same accuracy is conducted and is also positive. Update the probability that the patient has the disease.
Chapter 2 Solutions
Elementary Statistics with MyStatLab Access Code [With CDROM]
Ch. 2.2 - Frequency Distribution Table 2-2 on page 45 is a...Ch. 2.2 - Relative Frequency Distribution After construction...Ch. 2.2 - Do You Believe? In a Harris Interactive survey,...Ch. 2.2 - Analyzing a Frequency Distribution The...Ch. 2.2 - In Exercises 5-10, identify the class width, class...Ch. 2.2 - In Exercises 5-10, identify the class width, class...Ch. 2.2 - In Exercises 5-10, identify the class width, class...Ch. 2.2 - In Exercises 5-10, identify the class width, class...Ch. 2.2 - In Exercises 5-10, identify the class width, class...Ch. 2.2 - In Exercises 5-10, identify the class width, class...
Ch. 2.2 - Normal Distributions. In Exercises 11-14, answer...Ch. 2.2 - Normal Distributions. In Exercises 11-14, answer...Ch. 2.2 - Normal Distributions. In Exercises 11-14, answer...Ch. 2.2 - Normal Distributions. In Exercises 11-14, answer...Ch. 2.2 - Relative Frequencies for Comparisons. In Exercises...Ch. 2.2 - Relative Frequencies for Comparisons. In Exercises...Ch. 2.2 - Cumulative Frequency Distributions. In Exercises...Ch. 2.2 - Cumulative Frequency Distributions. In Exercises...Ch. 2.2 - Analysis of Last Digits Heights of statistics...Ch. 2.2 - Analysis of Last Digits Weights of respondents...Ch. 2.2 - Constructing Frequency Distributions. In Exercises...Ch. 2.2 - Constructing Frequency Distributions. In Exercises...Ch. 2.2 - Constructing Frequency Distributions. In Exercises...Ch. 2.2 - Constructing Frequency Distributions. In Exercises...Ch. 2.2 - Constructing Frequency Distributions. In Exercises...Ch. 2.2 - Constructing Frequency Distributions. In Exercises...Ch. 2.2 - Constructing Frequency Distributions. In Exercises...Ch. 2.2 - Constructing Frequency Distributions. In Exercises...Ch. 2.2 - Categorical Data. In Exercises 29-32, use the...Ch. 2.2 - Categorical Data. In Exercises 29-32, use the...Ch. 2.2 - Categorical Data. In Exercises 29-32, use the...Ch. 2.2 - Categorical Data. In Exercises 29-32, use the...Ch. 2.2 - Interpreting Effects of Outliers Refer to Data Set...Ch. 2.2 - Number of Classes According to what is known as...Ch. 2.3 - Prob. 1BSCCh. 2.3 - Voluntary Response Sample The histogram in Figure...Ch. 2.3 - Small Data NASA provides these duration times (in...Ch. 2.3 - Normal Distribution When it refers to a normal...Ch. 2.3 - Interpreting a Histogram. In Exercises 5-8, answer...Ch. 2.3 - Interpreting a Histogram. In Exercises 5-8, answer...Ch. 2.3 - Interpreting a Histogram. In Exercises 5-8, answer...Ch. 2.3 - Interpreting a Histogram. In Exercises 5-8, answer...Ch. 2.3 - Analysis of Last Digits Use the frequency...Ch. 2.3 - Analysis of Last Digits Use the frequency...Ch. 2.3 - Constructing Histograms. In Exercises 9-18,...Ch. 2.3 - Constructing Histograms. In Exercises 9-18,...Ch. 2.3 - Constructing Histograms. In Exercises 9-18,...Ch. 2.3 - Constructing Histograms. In Exercises 9-18,...Ch. 2.3 - Prob. 15BSCCh. 2.3 - Constructing Histograms. In Exercises 9-18,...Ch. 2.3 - Constructing Histograms. In Exercises 9-18,...Ch. 2.3 - Constructing Histograms. In Exercises 9-18,...Ch. 2.3 - Back-to-Back Relative Frequency Histograms When...Ch. 2.3 - Interpreting a Histogram. In Exercises 5-8, answer...Ch. 2.4 - Bar Chart and Pareto Chart A bar chart and a...Ch. 2.4 - Scatterplot What is a scatterplot? What type of...Ch. 2.4 - SAT Scores Listed below are SAT scores from a...Ch. 2.4 - SAT Scores Given that the data in Exercise 3 were...Ch. 2.4 - Scatterplots. In Exercises 5-8, use the given...Ch. 2.4 - Scatterplots. In Exercises 5-8, use the given...Ch. 2.4 - Scatterplots. In Exercises 5-8, use the given...Ch. 2.4 - Scatterplots. In Exercises 5-8, use the given...Ch. 2.4 - Time-Series Graphs. In Exercises 9 and 10,...Ch. 2.4 - Time-Series Graphs. In Exercises 9 and 10,...Ch. 2.4 - Dotplots. In Exercises II and 12, construct the...Ch. 2.4 - Dotplots. In Exercises 11 and 12, construct the...Ch. 2.4 - Stemplots. In Exercises 13 and 14, construct the...Ch. 2.4 - Stemplots. In Exercises 13 and 14, construct the...Ch. 2.4 - Pareto Charts. In Exercises 15 and 16, construct...Ch. 2.4 - Pareto Charts. In Exercises 15 and 16, construct...Ch. 2.4 - Pie Charts. In Exercises 17 and 18, construct the...Ch. 2.4 - Pie Charts. In Exercises 17 and 18, construct the...Ch. 2.4 - Frequency Polygon. In Exercises 19 and 20,...Ch. 2.4 - Frequency Polygon. In Exercises 19 and 20,...Ch. 2.4 - Deceptive Graphs. In Exercises 21-24, identify the...Ch. 2.4 - Deceptive Graphs. In Exercises 21-24, identify the...Ch. 2.4 - Deceptive Graphs. In Exercises 21-24, identify the...Ch. 2.4 - Deceptive Graphs. In Exercises 21-24, identify the...Ch. 2.4 - Back-to-Back Stemplots Exercise 19 in Section 2-3...Ch. 2 - When one is constructing a table representing the...Ch. 2 - When one is constructing a table representing the...Ch. 2 - When one is constructing a table representing the...Ch. 2 - A stemplot is created from the intervals (min)...Ch. 2 - In the California Daily 4 lottery, four digits...Ch. 2 - In an investigation of the travel costs of college...Ch. 2 - In an investigation of the relationship between...Ch. 2 - As a quality control manager at Sony, you find...Ch. 2 - What characteristic of a data set can be better...Ch. 2 - A histogram is to be constructed from the brain...Ch. 2 - Frequency Distribution of Brain Volumes Construct...Ch. 2 - Histogram of Brain Volumes Construct the histogram...Ch. 2 - Dotplot of California Lottery In the California...Ch. 2 - Stemplot of IQ Scores Listed below are the first...Ch. 2 - CO Emissions Listed below are the amounts (million...Ch. 2 - CO and NO Emissions Exercise 5 lists the amounts...Ch. 2 - Sports Equipment According to USA Today, the...Ch. 2 - In Exercises 1-5, refer to the table in the...Ch. 2 - In Exercises 1-5, refer to the table in the...Ch. 2 - In Exercises 1-5, refer to the table in the...Ch. 2 - In Exercises 1-5, refer to the table in the...Ch. 2 - In Exercises 1-5, refer to the table in the...Ch. 2 - Grooming Time Listed below are times (minutes)...Ch. 2 - Histogram of Grooming Times Use the frequency...Ch. 2 - Stemplot of Grooming Times Use the data from...Ch. 2 - Technology Project It was noted in this section...Ch. 2 - Flight Planning Data Set 15 in Appendix B includes...Ch. 2 - Prob. 2FDDCh. 2 - Flight Planning Data Set 15 in Appendix B includes...
Knowledge Booster


Learn more about
Need a deep-dive on the concept behind this application? Look no further. Learn more about this topic, statistics and related others by exploring similar questions and additional content below.Similar questions
- 4. Linear Regression - Model Assumptions and Interpretation A real estate analyst is studying how house prices (Y) are related to house size in square feet (X). A simple linear regression model is proposed: The analyst fits the model and obtains: • Ŷ50,000+150X YBoB₁X + € • R² = 0.76 • Residuals show a fan-shaped pattern when plotted against fitted values. Questions: a) Interpret the slope coefficient in context. b) Explain what the R² value tells us about the model's performance. c) Based on the residual pattern, what regression assumption is likely violated? What might be the consequence? d) Suggest at least two remedies to improve the model, based on the residual analysis.arrow_forward5. Probability Distributions – Continuous Random Variables A factory machine produces metal rods whose lengths (in cm) follow a continuous uniform distribution on the interval [98, 102]. Questions: a) Define the probability density function (PDF) of the rod length.b) Calculate the probability that a randomly selected rod is shorter than 99 cm.c) Determine the expected value and variance of rod lengths.d) If a sample of 25 rods is selected, what is the probability that their average length is between 99.5 cm and 100.5 cm? Justify your answer using the appropriate distribution.arrow_forward2. Hypothesis Testing - Two Sample Means A nutritionist is investigating the effect of two different diet programs, A and B, on weight loss. Two independent samples of adults were randomly assigned to each diet for 12 weeks. The weight losses (in kg) are normally distributed. Sample A: n = 35, 4.8, s = 1.2 Sample B: n=40, 4.3, 8 = 1.0 Questions: a) State the null and alternative hypotheses to test whether there is a significant difference in mean weight loss between the two diet programs. b) Perform a hypothesis test at the 5% significance level and interpret the result. c) Compute a 95% confidence interval for the difference in means and interpret it. d) Discuss assumptions of this test and explain how violations of these assumptions could impact the results.arrow_forward
- 1. Sampling Distribution and the Central Limit Theorem A company produces batteries with a mean lifetime of 300 hours and a standard deviation of 50 hours. The lifetimes are not normally distributed—they are right-skewed due to some batteries lasting unusually long. Suppose a quality control analyst selects a random sample of 64 batteries from a large production batch. Questions: a) Explain whether the distribution of sample means will be approximately normal. Justify your answer using the Central Limit Theorem. b) Compute the mean and standard deviation of the sampling distribution of the sample mean. c) What is the probability that the sample mean lifetime of the 64 batteries exceeds 310 hours? d) Discuss how the sample size affects the shape and variability of the sampling distribution.arrow_forwardA biologist is investigating the effect of potential plant hormones by treating 20 stem segments. At the end of the observation period he computes the following length averages: Compound X = 1.18 Compound Y = 1.17 Based on these mean values he concludes that there are no treatment differences. 1) Are you satisfied with his conclusion? Why or why not? 2) If he asked you for help in analyzing these data, what statistical method would you suggest that he use to come to a meaningful conclusion about his data and why? 3) Are there any other questions you would ask him regarding his experiment, data collection, and analysis methods?arrow_forwardBusinessarrow_forward
- What is the solution and answer to question?arrow_forwardTo: [Boss's Name] From: Nathaniel D Sain Date: 4/5/2025 Subject: Decision Analysis for Business Scenario Introduction to the Business Scenario Our delivery services business has been experiencing steady growth, leading to an increased demand for faster and more efficient deliveries. To meet this demand, we must decide on the best strategy to expand our fleet. The three possible alternatives under consideration are purchasing new delivery vehicles, leasing vehicles, or partnering with third-party drivers. The decision must account for various external factors, including fuel price fluctuations, demand stability, and competition growth, which we categorize as the states of nature. Each alternative presents unique advantages and challenges, and our goal is to select the most viable option using a structured decision-making approach. Alternatives and States of Nature The three alternatives for fleet expansion were chosen based on their cost implications, operational efficiency, and…arrow_forwardBusinessarrow_forward
- Why researchers are interested in describing measures of the center and measures of variation of a data set?arrow_forwardWHAT IS THE SOLUTION?arrow_forwardThe following ordered data list shows the data speeds for cell phones used by a telephone company at an airport: A. Calculate the Measures of Central Tendency from the ungrouped data list. B. Group the data in an appropriate frequency table. C. Calculate the Measures of Central Tendency using the table in point B. 0.8 1.4 1.8 1.9 3.2 3.6 4.5 4.5 4.6 6.2 6.5 7.7 7.9 9.9 10.2 10.3 10.9 11.1 11.1 11.6 11.8 12.0 13.1 13.5 13.7 14.1 14.2 14.7 15.0 15.1 15.5 15.8 16.0 17.5 18.2 20.2 21.1 21.5 22.2 22.4 23.1 24.5 25.7 28.5 34.6 38.5 43.0 55.6 71.3 77.8arrow_forward
arrow_back_ios
SEE MORE QUESTIONS
arrow_forward_ios
Recommended textbooks for you
 Glencoe Algebra 1, Student Edition, 9780079039897...AlgebraISBN:9780079039897Author:CarterPublisher:McGraw Hill
 Holt Mcdougal Larson Pre-algebra: Student Edition...AlgebraISBN:9780547587776Author:HOLT MCDOUGALPublisher:HOLT MCDOUGAL
 Big Ideas Math A Bridge To Success Algebra 1: Stu...AlgebraISBN:9781680331141Author:HOUGHTON MIFFLIN HARCOURTPublisher:Houghton Mifflin Harcourt
 Trigonometry (MindTap Course List)TrigonometryISBN:9781305652224Author:Charles P. McKeague, Mark D. TurnerPublisher:Cengage Learning
Glencoe Algebra 1, Student Edition, 9780079039897...
Algebra
ISBN:9780079039897
Author:Carter
Publisher:McGraw Hill
Holt Mcdougal Larson Pre-algebra: Student Edition...
Algebra
ISBN:9780547587776
Author:HOLT MCDOUGAL
Publisher:HOLT MCDOUGAL
Big Ideas Math A Bridge To Success Algebra 1: Stu...
Algebra
ISBN:9781680331141
Author:HOUGHTON MIFFLIN HARCOURT
Publisher:Houghton Mifflin Harcourt
Trigonometry (MindTap Course List)
Trigonometry
ISBN:9781305652224
Author:Charles P. McKeague, Mark D. Turner
Publisher:Cengage Learning
Time Series Analysis Theory & Uni-variate Forecasting Techniques; Author: Analytics University;https://www.youtube.com/watch?v=_X5q9FYLGxM;License: Standard YouTube License, CC-BY
Operations management 101: Time-series, forecasting introduction; Author: Brandoz Foltz;https://www.youtube.com/watch?v=EaqZP36ool8;License: Standard YouTube License, CC-BY