
Concept explainers
Videos
Just as money doesn't by happiness for individuals, the two don't necessarily go together for countries either. However the
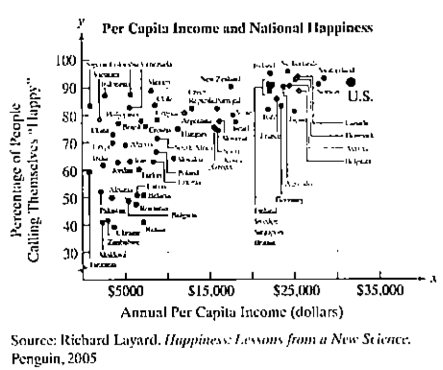
Draw a line that fits the data so that the spread of the data points around the line is as small as possible. Use the coordinates of two points along your line to write the slope-intercept form of its equation. Express the equation in function notation and use the linear function to make a prediction about national happiness based on per capita income.
Want to see the full answer?
Check out a sample textbook solution
Chapter 2 Solutions
MyLab Math with Pearson eText -- Standalone Access Card -- for College Algebra (7th Edition)(Outer package may vary)


- 2. A microwave manufacturing firm has determined that their profit function is P(x)=-0.0014x+0.3x²+6x-355 , where is the number of microwaves sold annually. a. Graph the profit function using a calculator. b. Determine a reasonable viewing window for the function. c. Approximate all of the zeros of the function using the CALC menu of your calculator. d. What must be the range of microwaves sold in order for the firm to profit?arrow_forwardA clothing manufacturer's profitability can be modeled by p (x)=-x4 + 40x² - 144, where .x is the number of items sold in thousands and p (x) is the company's profit in thousands of dollars. a. Sketch the function on your calculator and describe the end behavior. b. Determine the zeros of the function. c. Between what two values should the company sell in order to be profitable? d. Explain why only two of the zeros are considered in part c.arrow_forwardCCSS REASONING The number of subscribers using pagers in the United States can be modeled by f(x) = 0.015x4 -0.44x³ +3.46x² - 2.7x+9.68 where x is the number of years after 1990 and f(x) is the number of subscribers in millions. a. Graph the function. b. Describe the end behavior of the graph. c. What does the end behavior suggest about the number of pager subscribers? d. Will this trend continue indefinitely? Explain your reasoning.arrow_forward
- Can you help me solve this?arrow_forwardName Assume there is the following simplified grade book: Homework Labs | Final Exam | Project Avery 95 98 90 100 Blake 90 96 Carlos 83 79 Dax 55 30 228 92 95 79 90 65 60 Assume that the weights used to compute the final grades are homework 0.3, labs 0.2, the final 0.35, and the project 0.15. | Write an explicit formula to compute Avery's final grade using a single inner product. Write an explicit formula to compute everyone's final grade simultane- ously using a single matrix-vector product.arrow_forward1. Explicitly compute by hand (with work shown) the following Frobenius inner products 00 4.56 3.12 (a) ((º º º). (156 (b) 10.9 -1 0 2)), Fro 5')) Froarrow_forward
- 3. Let 4 0 0 00 0 0 1.2 0 00 0 0 0 -10.1 0 0 0 D = 0 0 0 00 0 0 0 0 05 0 0 0 0 0 0 2.8 Either explicitly compute D-¹ or explain why it doesn't exist.arrow_forward4. [9 points] Assume that B, C, E are all 3 x 3 matrices such that BC == -64 -1 0 3 4 4 4 -2 2 CB=-1-2 4 BE -2 1 3 EC = 1 3 2 -7, 1 6 -6 2-5 -7 -2 Explicitly compute the following by hand. (I.e., write out the entries of the 3 × 3 matrix.) (a) [3 points] B(E+C) (b) [3 points] (E+B)C (c) [3 points] ETBTarrow_forward6. Consider the matrices G = 0 (3) -3\ -3 2 and H = -1 2 0 5 0 5 5 noting that H(:, 3) = 2H(:,1) + H(:, 2). Is G invertible? Explain your answer. Is H invertible? Explain your answer. Use co-factor expansion to find the determinant of H. (Hint: expand the 2nd or 3rd row)arrow_forward
- For the matrix A = = ( 6 }) . explicitly compute by hand (with work shown) the following. I2A, where I2 is the 2 × 2 identity matrix. A-1 solving the following linear systems by using A-¹: c+y= 1 y = 1 (d) (e) (f) A² find the diagonal entries of Aarrow_forwardIf 3x−y=12, what is the value of 8x / 2y A) 212B) 44C) 82D) The value cannot be determined from the information given.arrow_forwardC=59(F−32) The equation above shows how temperature F, measured in degrees Fahrenheit, relates to a temperature C, measured in degrees Celsius. Based on the equation, which of the following must be true? A temperature increase of 1 degree Fahrenheit is equivalent to a temperature increase of 59 degree Celsius. A temperature increase of 1 degree Celsius is equivalent to a temperature increase of 1.8 degrees Fahrenheit. A temperature increase of 59 degree Fahrenheit is equivalent to a temperature increase of 1 degree Celsius. A) I onlyB) II onlyC) III onlyD) I and II onlyarrow_forward
 Glencoe Algebra 1, Student Edition, 9780079039897...AlgebraISBN:9780079039897Author:CarterPublisher:McGraw Hill

 Elementary AlgebraAlgebraISBN:9780998625713Author:Lynn Marecek, MaryAnne Anthony-SmithPublisher:OpenStax - Rice University
 Holt Mcdougal Larson Pre-algebra: Student Edition...AlgebraISBN:9780547587776Author:HOLT MCDOUGALPublisher:HOLT MCDOUGAL