Americans are getting married later in life, or not getting married at all. In 2010, more than half of Americans ages 25 through 29 were unmarried. The bar graphs show the percentage of never-married men and women in this age group for four selected year. The date are displayed as two sets of four points each, one scatter plot for the percentage of never-married American men and one for the percentage of never-married American women, Also shown for each scatter plot is a line that through or near the four points Use these lines to solve Exercises 88. In this exercise, you will use the red line for the men shown on the scatter plot to develop a model for the percentage of never-married American males ages 25-29. a. Use the two points whose coordinates are shown by the voice balloons to find the point-slope from of the equation of the line that models the percentage of never-married American males ages 25-90, y, x years after 1980. b. Write the equation form part (a) in slope-intercept form. Use function notation. c. Use the linear function to predict the percentage of never-married American males ages 25-29, in 2020.
Americans are getting married later in life, or not getting married at all. In 2010, more than half of Americans ages 25 through 29 were unmarried. The bar graphs show the percentage of never-married men and women in this age group for four selected year. The date are displayed as two sets of four points each, one scatter plot for the percentage of never-married American men and one for the percentage of never-married American women, Also shown for each scatter plot is a line that through or near the four points Use these lines to solve Exercises 88. In this exercise, you will use the red line for the men shown on the scatter plot to develop a model for the percentage of never-married American males ages 25-29. a. Use the two points whose coordinates are shown by the voice balloons to find the point-slope from of the equation of the line that models the percentage of never-married American males ages 25-90, y, x years after 1980. b. Write the equation form part (a) in slope-intercept form. Use function notation. c. Use the linear function to predict the percentage of never-married American males ages 25-29, in 2020.
Solution Summary: The author analyzes the equation of a line that models the percentage of never married American females aged 25–29 years after 1980.
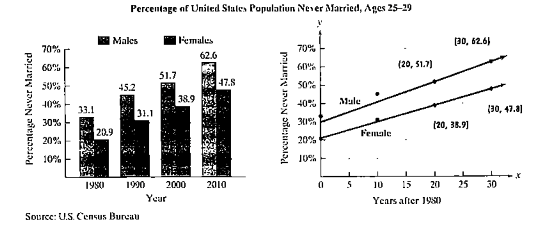
Americans are getting married later in life, or not getting married at all. In 2010, more than half of Americans ages 25 through 29 were unmarried. The bar graphs show the percentage of never-married men and women in this age group for four selected year. The date are displayed as two sets of four points each, one scatter plot for the percentage of never-married American men and one for the percentage of never-married American women, Also shown for each scatter plot is a line that through or near the four points Use these lines to solve Exercises 88.
In this exercise, you will use the red line for the men shown on the scatter plot to develop a model for the percentage of never-married American males ages 25-29.
a. Use the two points whose coordinates are shown by the voice balloons to find the point-slope from of the equation of the line that models the percentage of never-married American males ages 25-90, y, x years after 1980.
b. Write the equation form part (a) in slope-intercept form. Use function notation.
c. Use the linear function to predict the percentage of never-married American males ages 25-29, in 2020.
Definition Definition Representation of the direction and degree of correlation in graphical form. The grouping of points that are plotted makes it a scatter diagram. A line can be drawn showing the relationship based on the direction of points and their distance from each other.
Evaluate the following expression and show your work to support your calculations.
a). 6!
b).
4!
3!0!
7!
c).
5!2!
d). 5!2!
e).
n!
(n - 1)!
Amy and Samiha have a hat that contains two playing cards, one ace and one king. They are playing a game where they randomly pick a card out of the hat four times, with replacement.
Amy thinks that the probability of getting exactly two aces in four picks is equal to the probability of not getting exactly two aces in four picks. Samiha disagrees. She thinks that the probability of not getting exactly two aces is greater.
The sample space of possible outcomes is listed below. A represents an ace, and K represents a king. Who is correct?
Consider the exponential function f(x) = 12x. Complete the sentences about the key features of the graph.
The domain is all real numbers.
The range is y> 0.
The equation of the asymptote is y = 0
The y-intercept is 1
Chapter 2 Solutions
Mylab Math With Pearson Etext -- 18 Week Standalone Access Card -- For Algebra For College Students
Need a deep-dive on the concept behind this application? Look no further. Learn more about this topic, algebra and related others by exploring similar questions and additional content below.


 Glencoe Algebra 1, Student Edition, 9780079039897...AlgebraISBN:9780079039897Author:CarterPublisher:McGraw Hill
 Holt Mcdougal Larson Pre-algebra: Student Edition...AlgebraISBN:9780547587776Author:HOLT MCDOUGALPublisher:HOLT MCDOUGAL
 Functions and Change: A Modeling Approach to Coll...AlgebraISBN:9781337111348Author:Bruce Crauder, Benny Evans, Alan NoellPublisher:Cengage Learning
 Big Ideas Math A Bridge To Success Algebra 1: Stu...AlgebraISBN:9781680331141Author:HOUGHTON MIFFLIN HARCOURTPublisher:Houghton Mifflin Harcourt